Fact Checker DRAFT

Fact Checker of BMs of IPBES Assessments

Author
Affiliation

Rainer M Krug

Published

August 18, 2026

Doi
Abstract

The assessments Linked Open Data is used to conduct analysis and searches to discover new knowledge related to the assessments.

Introduction

IPBES assessments were converted / enhanced into Linked Open Data (LOD) using the ttl format.

Three assessments available in ttl format are currently:

Methods

Methodology is documented separately in the TD_* design documents. Note: these are currently stale relative to the implementation — treat them as a record of the design rationale rather than an up-to-date specification of the pipeline as it stands today.

The figures and tables in the Results section below are all produced by targets pipeline targets — see _targets.R and the corresponding R/build_*.R files for the exact computation behind each one.

Results

The dataset contains 5957 papers referenced in the background messages. Out of these, 496 were usable for the snowball search and also yielded results.

Show the code
#|

all_papers |>
  dplyr::summarise(
    n = dplyr::n(),
    n_key_paper = sum(oa_input, na.rm = TRUE),
    n_non_key_paper = sum(!oa_input, na.rm = TRUE),
    n_nkp_pre_2018 = sum(
      (!oa_input) & (publication_year <= 2018),
      na.rm = TRUE
    ), # Count of citing papers with publication_year <= 2018
    n_nkp_post_2018 = sum(
      (!oa_input) & (publication_year > 2018),
      na.rm = TRUE
    ), # Count of citing papers with publication_year > 2018
    .by = c(km, bm)
  ) |>
  dplyr::arrange(km, bm) |>
  IPBES.R::table_dt()

Publication types after 2018

Here we show the different types of publication after 2018 as identified by the snowbal search. All Sub-background messages are grouped.

type n
article 215574
book-chapter 24488
preprint 18820
dissertation 3999
peer-review 3492
conference-paper 3228
book 2255
review 1966
other 1678
reference-entry 1558
paratext 1549
report 796
editorial 566
data-paper 340
dataset 201
book-review 92
erratum 82
letter 40
conference-abstract 21
software-paper 18
supplementary-materials 14
retraction 13
software 1

This table shows the number of work types per sub-background message. It allows filtering as well as sorting and downloading.

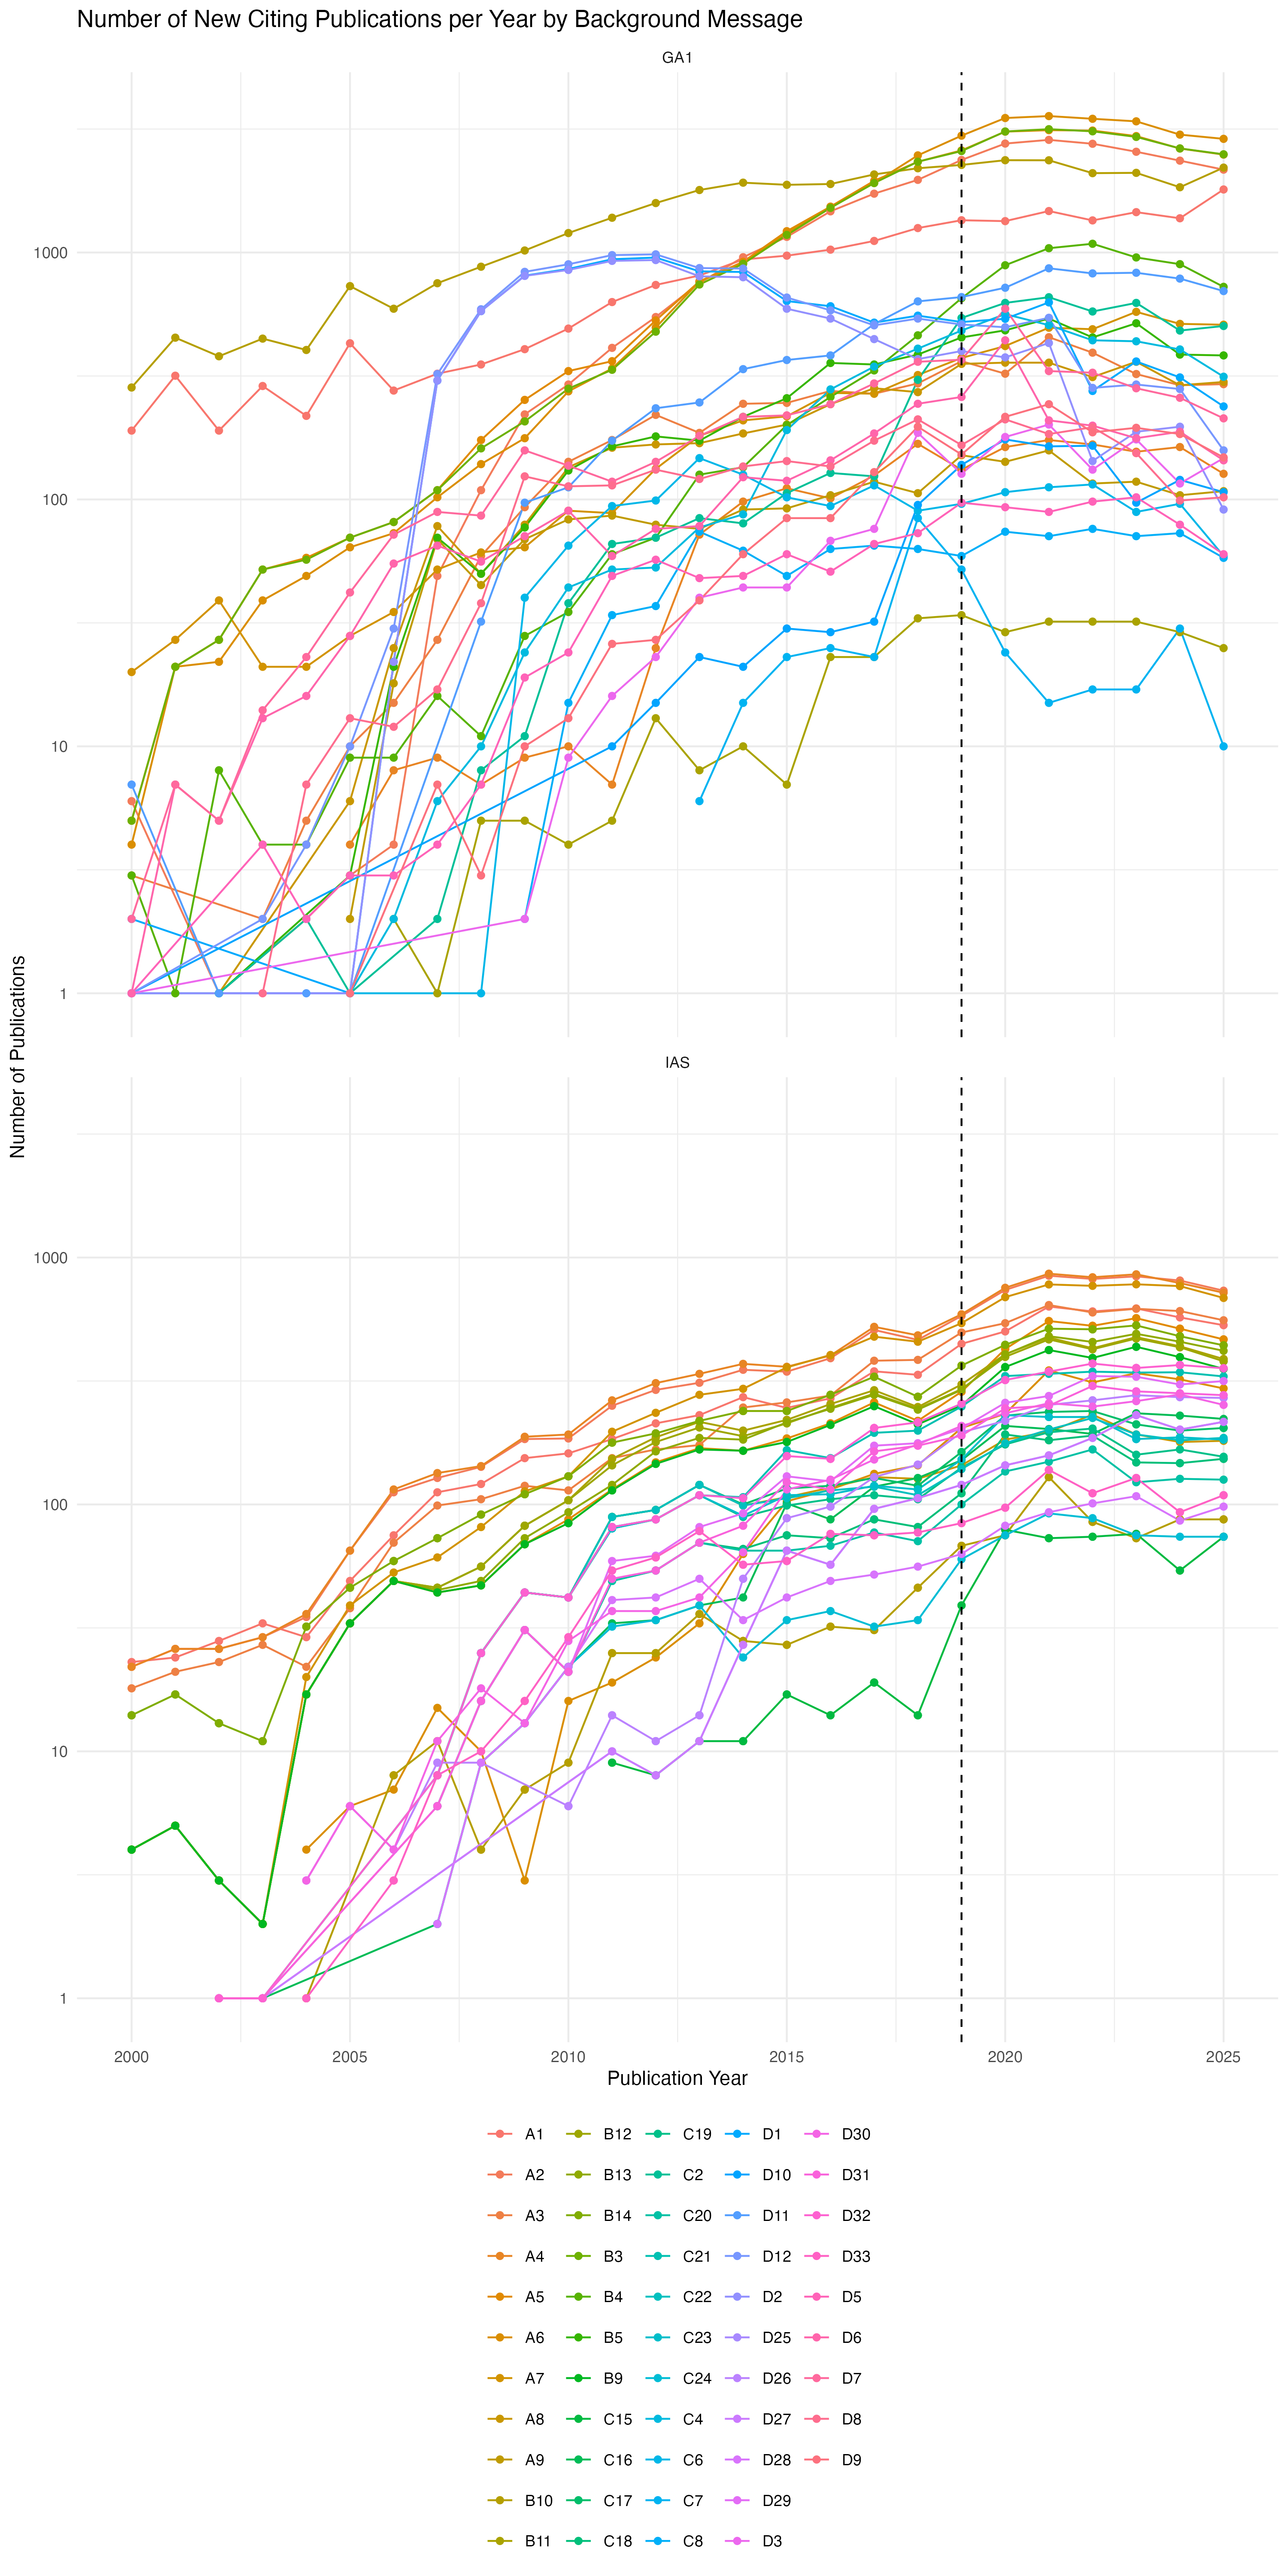
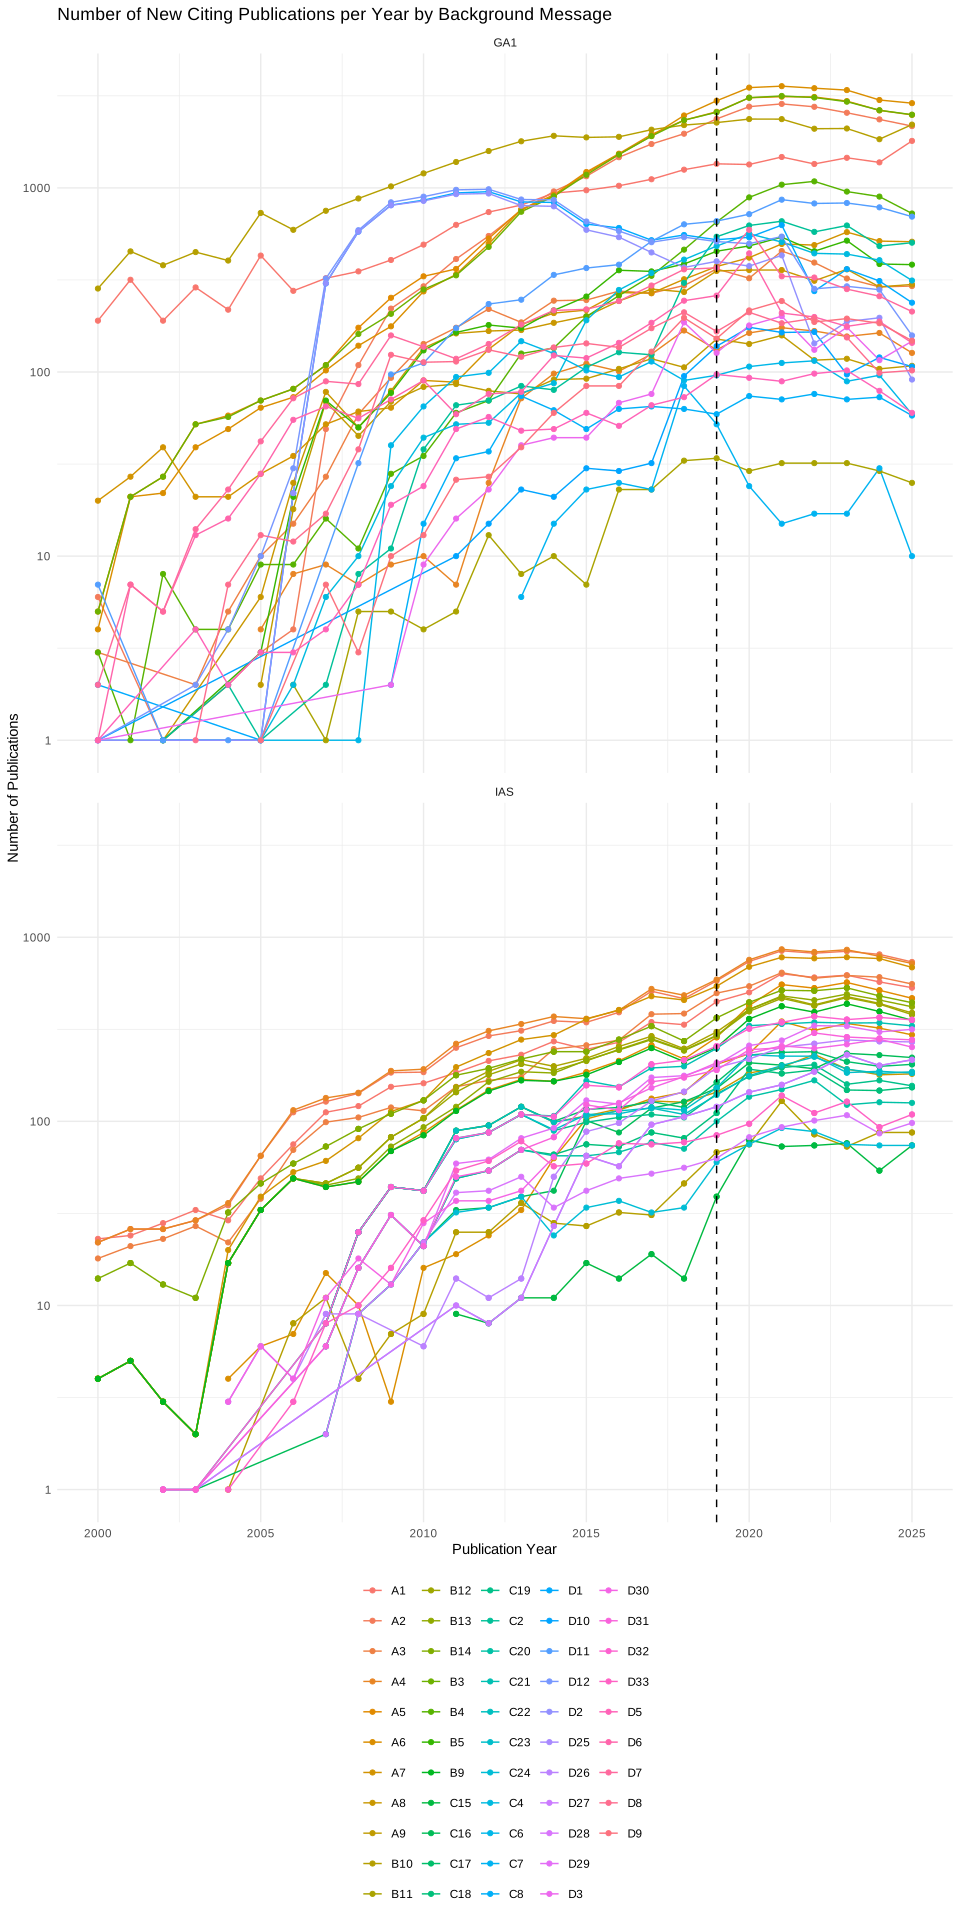
Publications per year

Overlap

In this section we will look at the number of background messages in which a given paper, as identified by their OpenAlex id. We willlook at that separatr for key-papers and non key-papers.

In the following tables only the papers which occur in more than one background message are included and only papers which were published after 2018.

This overlap can have different causes. Either there is an overlap of the key-papers, ehich results in an overlap of the new publications, or there is a topical overlap betweent the new paper themselves.

Overlap of Key Papers in Background Messages

The first table shows the overlap of the key-papers only regarding background messages.

Only papers occurring in more than 1 background message are shown.

Overlap of Papers after 2018 in Sub Messages

The second table shows the overlap of all papers after 2018 regarding sub messages.

Only papers with in more then 5 Sub Messages are shown.

Overlap of Papers after 2018 in Background Messages

The third table shows the overlap of all papers after 2018 regarding background messages.

Only papers with in more then 5 Background Messages are shown.

NLI Alignment Scores

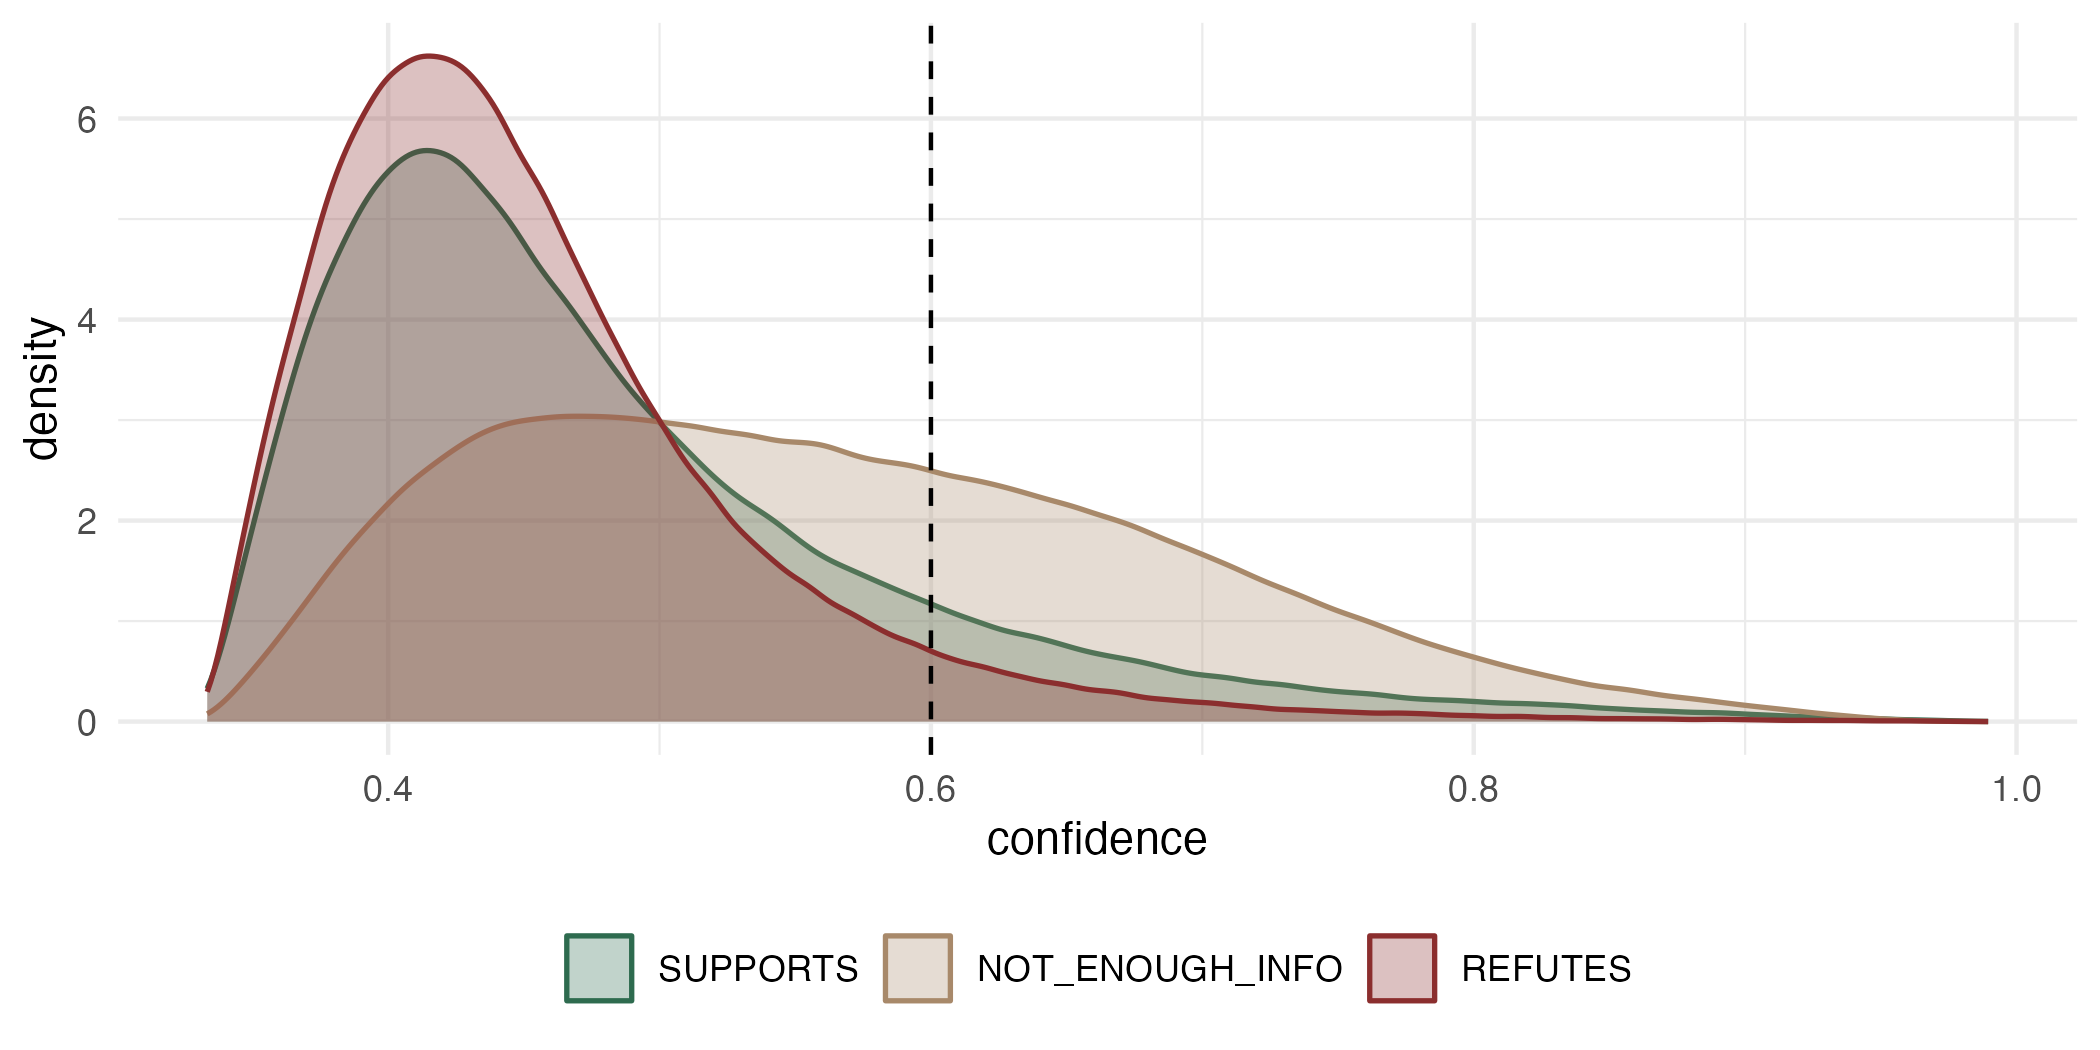
Each citing work is scored against its partition’s Background Message (BM) as SUPPORTS, REFUTES, or NOT_ENOUGH_INFO using a zero-shot NLI model. See TD_BM_NLI_approach for methodology.

Show the code
for (data_path in nli_overview_data_paths) {
  x <- readRDS(data_path)
  cat(sprintf("\n### %s (%s)\n\n", x$assessment, x$granularity %||% "sub_bm"))

  if (isTRUE(x$empty)) {
    cat("No NLI scores available yet for this assessment/granularity combination.\n\n")
    next
  }

  cat(sprintf(
    "- **%s** works scored\n- **%d** background messages\n- **%d** key messages\n- **%s%%** uncertain (confidence < 0.60)\n\n",
    format(x$n_total, big.mark = ","),
    x$n_bm,
    x$n_km,
    x$pct_unc
  ))

  fig_this <- nli_overview_figures_paths[
    grepl(paste0("_", x$assessment, "\\.png$"), nli_overview_figures_paths)
  ]
  plot_overall <- fig_this[grepl("plot_overall", fig_this)]
  plot_km <- fig_this[grepl("plot_km", fig_this)]
  plot_bm <- fig_this[grepl("plot_bm", fig_this)]
  plot_conf <- fig_this[grepl("plot_conf", fig_this)]
  plot_aln <- fig_this[grepl("plot_aln", fig_this)]

  cat("#### Label distribution\n\n")
  cat(
    knitr::kable(
      x$label_overall |>
        dplyr::mutate(
          label = factor(
            label,
            levels = c("SUPPORTS", "NOT_ENOUGH_INFO", "REFUTES")
          )
        ) |>
        dplyr::arrange(label),
      col.names = c("Label", "Works", "%")
    ),
    sep = "\n"
  )
  cat("\n\n")
  if (length(plot_overall)) {
    cat(sprintf("![](%s)\n\n", plot_overall))
  }

  cat("#### Interactive BM Explorer\n\n")
  cat(
    "Select a background message from the dropdown and a minimum confidence ",
    "from the slider. All works are always shown; the slider instead splits ",
    "each bar into a **solid** segment (confidence at or above the ",
    "threshold) and a **hollow/outlined** segment on top (below the ",
    "threshold, stacked) — in the label-distribution panel (each bar also ",
    "labelled `n / N`: works at/above the threshold vs. all works with that ",
    "label), the confidence panel (with a dashed line marking the ",
    "threshold), and the alignment panel. Mean/median confidence and the % ",
    "meeting the threshold are reported above the panels. Below the panels, ",
    "a second dropdown (default **REFUTES**) selects which label the ",
    "drill-down table lists — the actual works for the current BM + ",
    "threshold + label, sorted by confidence descending and capped at 50 ",
    "rows (the caption reports the true total when capped). Each work links ",
    "to its DOI where one exists (OpenAlex otherwise). **Download table ",
    "(CSV)** is not limited to the 50 rows shown — it exports up to 5,000 ",
    "matching works for the current BM + threshold + label (sorted by ",
    "confidence descending, flagged with a trailing comment line if even ",
    "that limit truncates the true match count), including the assessment ",
    "and BM as explicit columns.\n\n"
  )
  explorer_this <- nli_bm_explorer_paths[
    grepl(paste0("_", x$assessment, "\\.html$"), nli_bm_explorer_paths)
  ]
  if (length(explorer_this)) {
    cat(sprintf(
      '<iframe src="%s" width="100%%" height="1020px" style="border:none;"></iframe>\n\n',
      explorer_this
    ))
  }

  cat("#### Per Key Message\n\n")
  cat(
    knitr::kable(
      x$label_km,
      col.names = c("KM", "SUPPORTS %", "NEI %", "REFUTES %")
    ),
    sep = "\n"
  )
  cat("\n\n")
  if (length(plot_km)) {
    cat(sprintf("![](%s)\n\n", plot_km))
  }

  cat("#### Per Background Message\n\n")
  if (length(plot_bm)) {
    cat(sprintf("![](%s)\n\n", plot_bm))
  }
  cat(
    knitr::kable(
      x$table_bm,
      col.names = c("KM", "BM", "SUPPORTS %", "NEI %", "REFUTES %")
    ),
    sep = "\n"
  )
  cat("\n\n")

  cat("#### Confidence by label\n\n")
  cat(
    knitr::kable(
      x$conf_table,
      col.names = c("Label", "n", "Mean", "Median", "P25", "P75")
    ),
    sep = "\n"
  )
  cat("\n\n")
  if (length(plot_conf)) {
    cat(sprintf("![](%s)\n\n", plot_conf))
  }

  cat("#### Alignment score per BM\n\n")
  cat(
    knitr::kable(
      x$align_table,
      col.names = c(
        "KM",
        "BM",
        "n",
        "Mean aln",
        "SD",
        "SUPP %",
        "REF %",
        "NEI %",
        "Unc %"
      )
    ),
    sep = "\n"
  )
  cat("\n\n")
  if (length(plot_aln)) cat(sprintf("![](%s)\n\n", plot_aln))

  # AI Based Interpretation — last subsection of each assessment. Hand-
  # written commentary, deliberately scoped to the two signals of interest
  # (SUPPORTS and REFUTES) rather than the dominant NOT_ENOUGH_INFO label.
  # Recomputed against the current scored data (below) — will go stale as
  # scoring continues or the NLI config changes, so re-derive the numbers
  # from x$table_bm / x$label_km before trusting this after a rerun.
  cat("#### AI Based Interpretation\n\n")
  if (identical(x$assessment, "GA1")) {
    cat(r"----(
::: {.callout-note}
## About this section
Focused specifically on the SUPPORTS/REFUTES signals — NOT_ENOUGH_INFO (~71% of GA1 pairs) is set aside here as the least informative label. Written against the current scored data (2026-07-06); re-derive the numbers below from the tables above before trusting this after a rerun.
:::

**Key finding — KM D is the only reliable signal.** GA1 overall SUPPORTS (16.1%) edges out REFUTES (13.0%), but that gap is almost entirely driven by KM D (34.7% SUPPORTS vs 10.9% REFUTES). KMs A–C sit close to parity or worse — A: 15.0% vs 12.5%, B: 10.0% vs 14.2% (REFUTES-inflated), C: 14.5% vs 20.9% (REFUTES-inflated) — so the argmax label there carries little information on its own.

Within KM D, four BMs are unambiguous: **D3** (62.6% SUPPORTS vs 4.4% REFUTES), **D2** (44.0% vs 6.5%), **D1** (40.8% vs 10.3%), and **D12** (40.7% vs 11.1%) — all over 40% SUPPORTS at single-digit-to-low-teens REFUTES. The one exception inside KM D is **D10**, where REFUTES (15.2%) exceeds SUPPORTS (11.6%) — an outlier against its own KM's pattern, worth treating differently from its D-series siblings.

Likely reason: D-series BMs are probably more concrete and empirically testable — biodiversity metrics, species trends, ecosystem services — the kind of claims abstracts engage with directly.

::: {.callout-warning}
## REFUTES inflation — KMs A, B, C

The BMs with the widest REFUTES-over-SUPPORTS gap:

| BM | SUPPORTS | REFUTES | Gap (REFUTES − SUPPORTS) |
|----|---------|---------|---------|
| C6  |  5.2 % | 28.6 % | +23.4 |
| A9  | 13.8 % | 30.7 % | +16.9 |
| C8  |  8.3 % | 24.8 % | +16.5 |
| B11 | 15.4 % | 28.4 % | +13.0 |
| C7  |  7.1 % | 16.1 % |  +9.0 |
| B3  |  3.3 % | 12.0 % |  +8.7 |

Citing papers of an assessment being scored as majority-REFUTES at these margins is not credible. This is the well-documented zero-shot NLI failure mode: the hypothesis *"This paper refutes the following claim:"* draws spurious entailment when the BM contains complex, multi-part, or politically nuanced language. The model fires on surface-level topical tension rather than genuine contradiction.
:::

::: {.callout-note}
## Closest to parity — weakest signal

A handful of BMs have SUPPORTS and REFUTES within a couple of points of each other — the argmax label there is close to a coin flip:

- **A1** 12.9 % vs 11.0 %
- **B10** 12.7 % vs 14.7 %
- **A4** 9.7 % vs 11.8 %

For these, only the continuous alignment score (`p_supports − p_refutes`) carries any real information.
:::

##### Notable exception in KM A

**A2** (20.5% SUPPORTS, 11.0% REFUTES) is the clearest positive signal in KMs A–C outside of KM D — a nearly 10-point SUPPORTS lead, well ahead of its KM-A neighbours. Its claim is likely more concrete or empirically specific than the rest of KM A — worth inspecting manually as a calibration reference.

##### Operational implications

1. **Do not act on raw REFUTES labels for KMs A–C** without Phase-2 LLM review. NLI here is a coarse NEI filter, not a judgment.
2. **KM D SUPPORTS can be treated as the most reliable signal in the assessment** — D3, D2, D1, D12 in particular (all >40% SUPPORTS, single-digit-to-low-teens REFUTES). D10 is the one KM D BM that does NOT fit this pattern.
3. **Use `p_supports − p_refutes` for ranking** rather than argmax labels, especially for the near-parity BMs above.
4. **`max_length: 256` is probably hurting KMs A–C.** Truncating abstract tails removes findings — the part that matters most for support/refute judgements on conceptual BMs. The base-model-at-512 comparison (`deberta_zeroshot_v3`) is the highest-priority next experiment.
)----")
    cat(sprintf(
      "5. **Fine-tuning on BM citations** ([TD_NLI_training](%s)) would most help KMs A–C — the support/refute axis that zero-shot is fumbling. D-series BMs are already working.\n\n",
      td_doc_link("TD_NLI_training")
    ))
  } else if (identical(x$assessment, "IAS")) {
    cat(r"----(
::: {.callout-note}
## About this section
Focused specifically on the SUPPORTS/REFUTES signals — NOT_ENOUGH_INFO (~81% of IAS pairs) is set aside here as the least informative label. Written against the current scored data (2026-07-06); re-derive the numbers below from the tables above before trusting this after a rerun.
:::

**Key finding — IAS is weaker and more REFUTES-skewed than GA1.** Overall, IAS REFUTES (11.1%) actually *exceeds* SUPPORTS (8.4%) — the opposite of GA1's overall SUPPORTS lean (16.1% vs 13.0%). Unlike GA1, no IAS BM reaches D-series levels of confidence; the strongest SUPPORTS signal is markedly weaker.

::: {.callout-tip}
## Strongest SUPPORTS signal

**D33** (25.9% SUPPORTS vs 9.5% REFUTES, a 16-point lead) is the clearest positive signal in IAS, appearing under both KM-D4 and KM-D7. A handful of others lean the same way but at much lower absolute rates: **B13** (19.4% vs 10.8%), **D30** (8.7% vs 3.0%), **D27** (7.5% vs 1.8%), and **D25** (12.5% vs 7.2%). None of these approach GA1's D3/D2/D1/D12 margins.
:::

::: {.callout-warning}
## REFUTES inflation

The BMs with the widest REFUTES-over-SUPPORTS gap — the same zero-shot failure mode documented for GA1's KMs A–C:

| BM | SUPPORTS | REFUTES | Gap (REFUTES − SUPPORTS) |
|----|---------|---------|---------|
| A1  |  7.5 % | 22.6 % | +15.1 |
| A8  |  3.6 % | 16.7 % | +13.1 |
| D32 | 22.5 % | 33.5 % | +11.0 |
| A4  |  7.6 % | 17.6 % | +10.0 |
| C19 |  5.0 % | 14.3 % |  +9.3 |
| D28 |  8.1 % | 14.7 % |  +6.6 |

**D32** is a special case: both SUPPORTS and REFUTES are elevated (22.5% and 33.5%) rather than REFUTES alone — it appears under three different KMs (KM-D5, KM-D6, KM-D7), which may mean it's a genuinely contested or multi-faceted claim rather than a pure model artifact, and is worth a manual look before writing it off as noise.
:::

##### Operational implications

1. **Do not act on raw REFUTES labels anywhere in IAS** without Phase-2 LLM review — the overall REFUTES-over-SUPPORTS skew makes this an even higher priority here than for GA1's KMs A–C.
2. **D33 is the one IAS BM currently worth treating as a real signal** — everything else is either near parity or REFUTES-leaning.
3. **Use `p_supports − p_refutes` for ranking** rather than argmax labels; IAS's overall skew means a plain SUPPORTS-label count will systematically undercount real support.
4. **D32 deserves manual review before either accepting or discarding it** — high confidence in both directions, across multiple KMs, is a different failure mode from the single-direction REFUTES inflation seen elsewhere.
)----")
  } else {
    cat("No AI-based interpretation has been written yet for this assessment.\n\n")
  }
}

GA1 (sub_bm)

  • 1,869,582 works scored
  • 30 background messages
  • 4 key messages
  • 71.4% uncertain (confidence < 0.60)

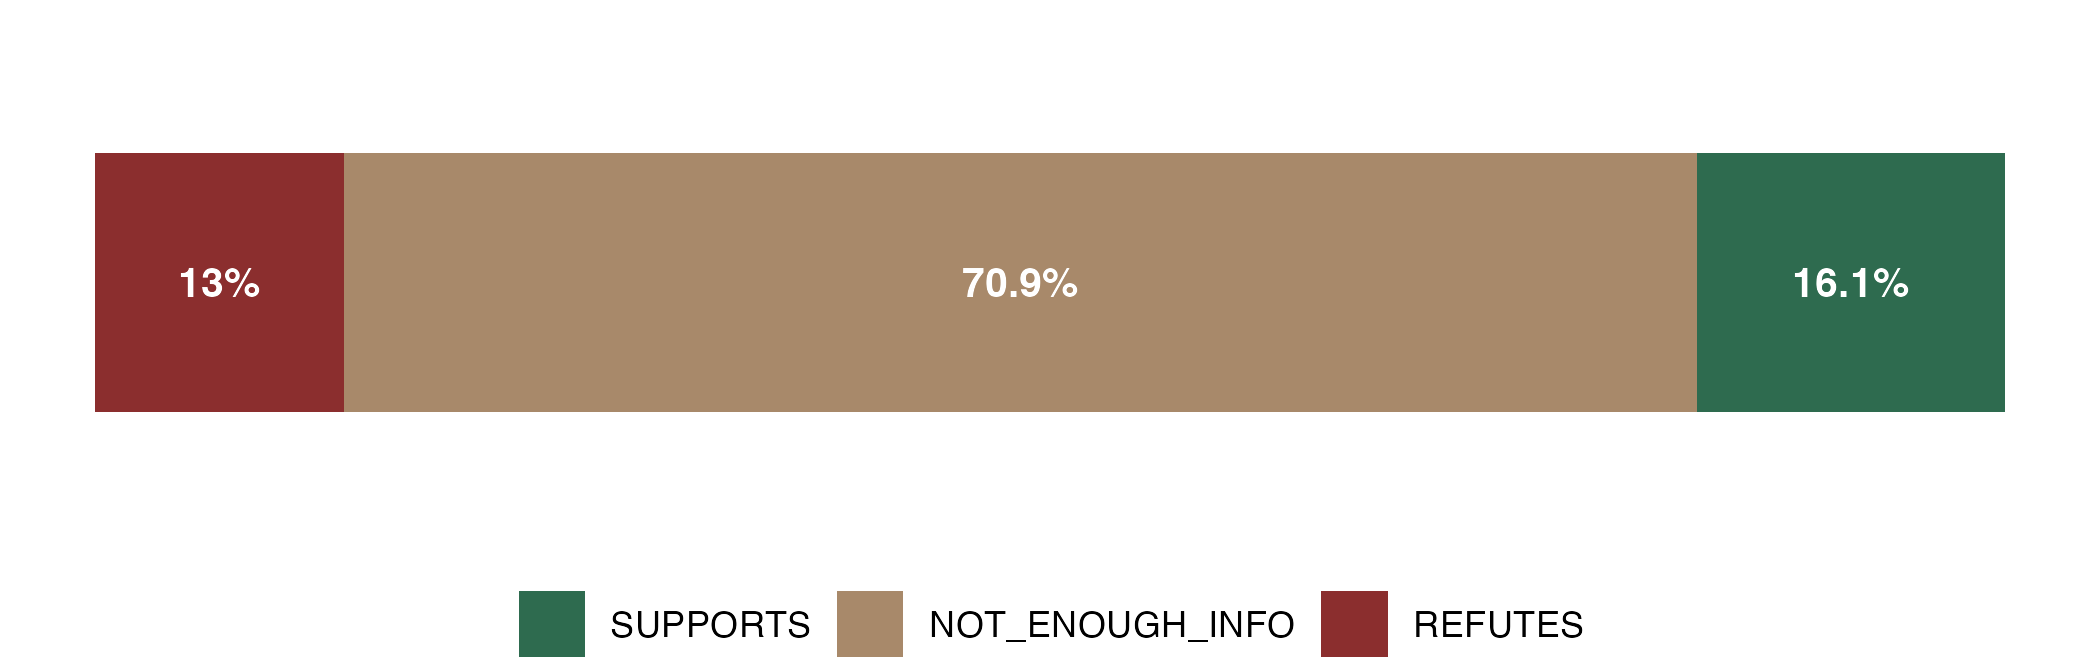
Label distribution

Label Works %
SUPPORTS 300296 16.1
NOT_ENOUGH_INFO 1325765 70.9
REFUTES 243521 13.0

Interactive BM Explorer

Select a background message from the dropdown and a minimum confidence from the slider. All works are always shown; the slider instead splits each bar into a solid segment (confidence at or above the threshold) and a hollow/outlined segment on top (below the threshold, stacked) — in the label-distribution panel (each bar also labelled n / N: works at/above the threshold vs. all works with that label), the confidence panel (with a dashed line marking the threshold), and the alignment panel. Mean/median confidence and the % meeting the threshold are reported above the panels. Below the panels, a second dropdown (default REFUTES) selects which label the drill-down table lists — the actual works for the current BM + threshold + label, sorted by confidence descending and capped at 50 rows (the caption reports the true total when capped). Each work links to its DOI where one exists (OpenAlex otherwise). Download table (CSV) is not limited to the 50 rows shown — it exports up to 5,000 matching works for the current BM + threshold + label (sorted by confidence descending, flagged with a trailing comment line if even that limit truncates the true match count), including the assessment and BM as explicit columns.

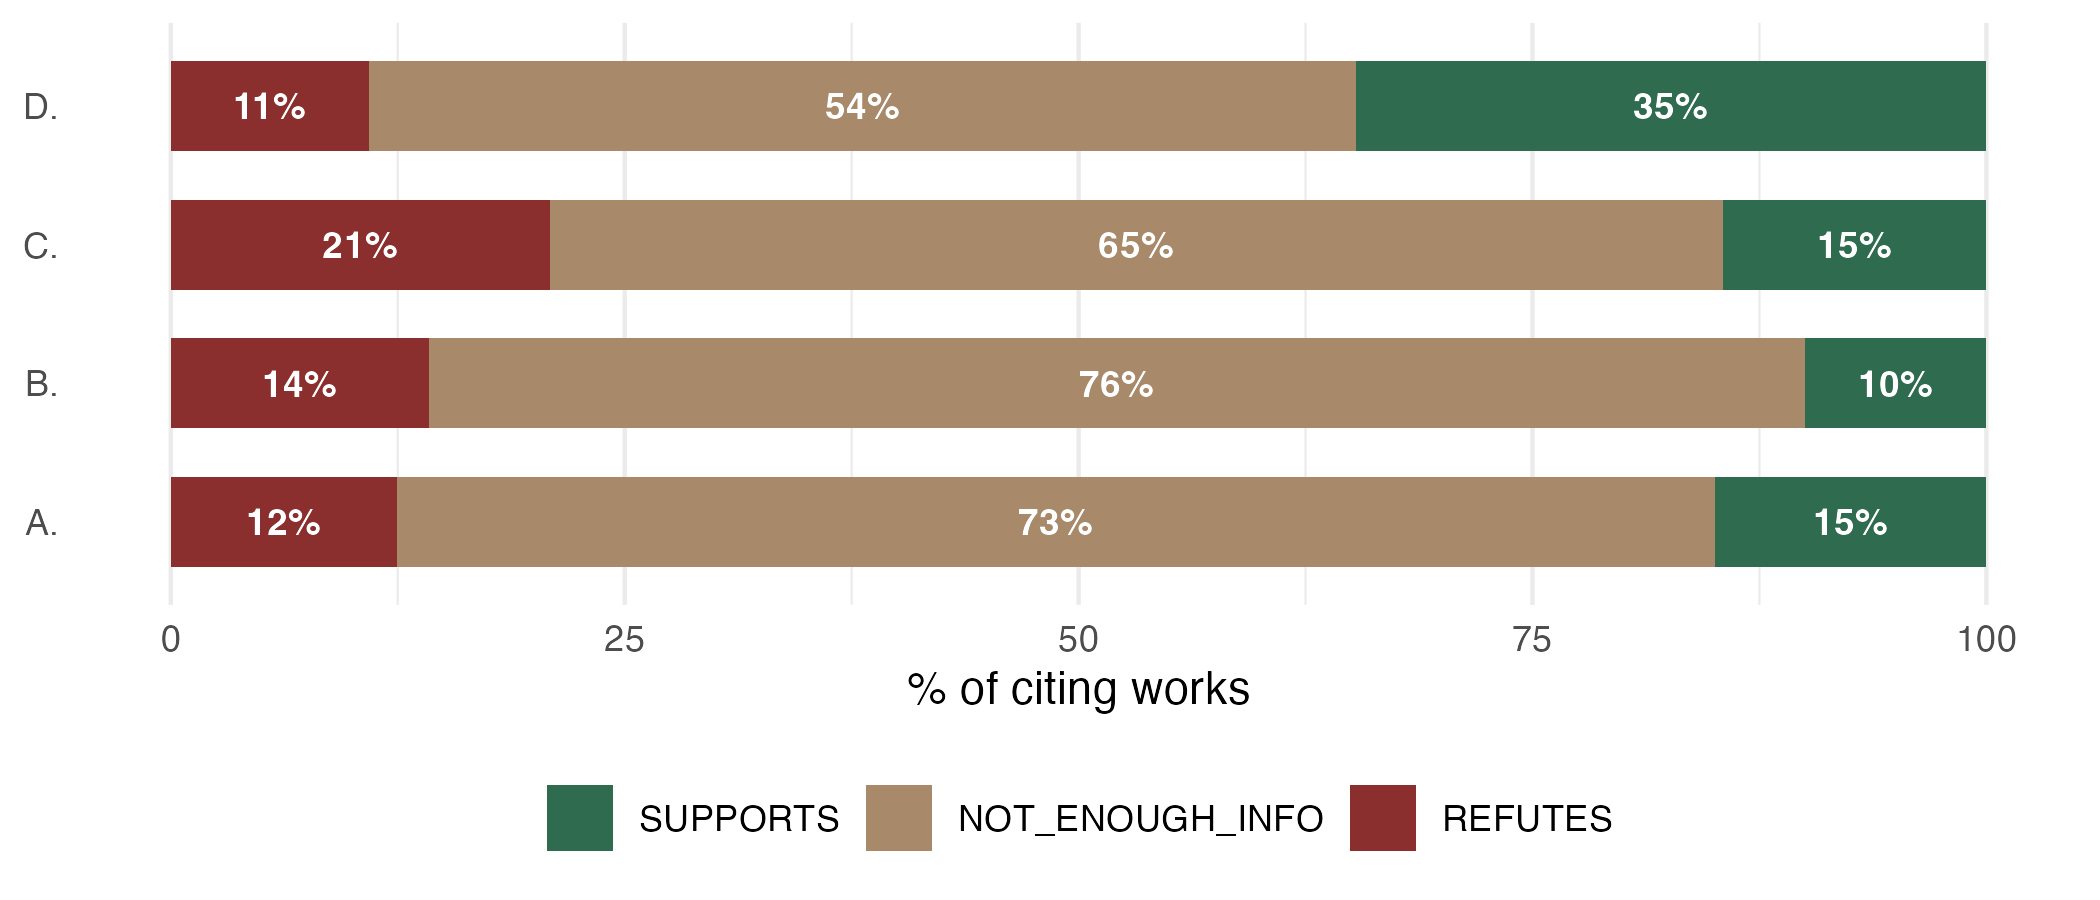
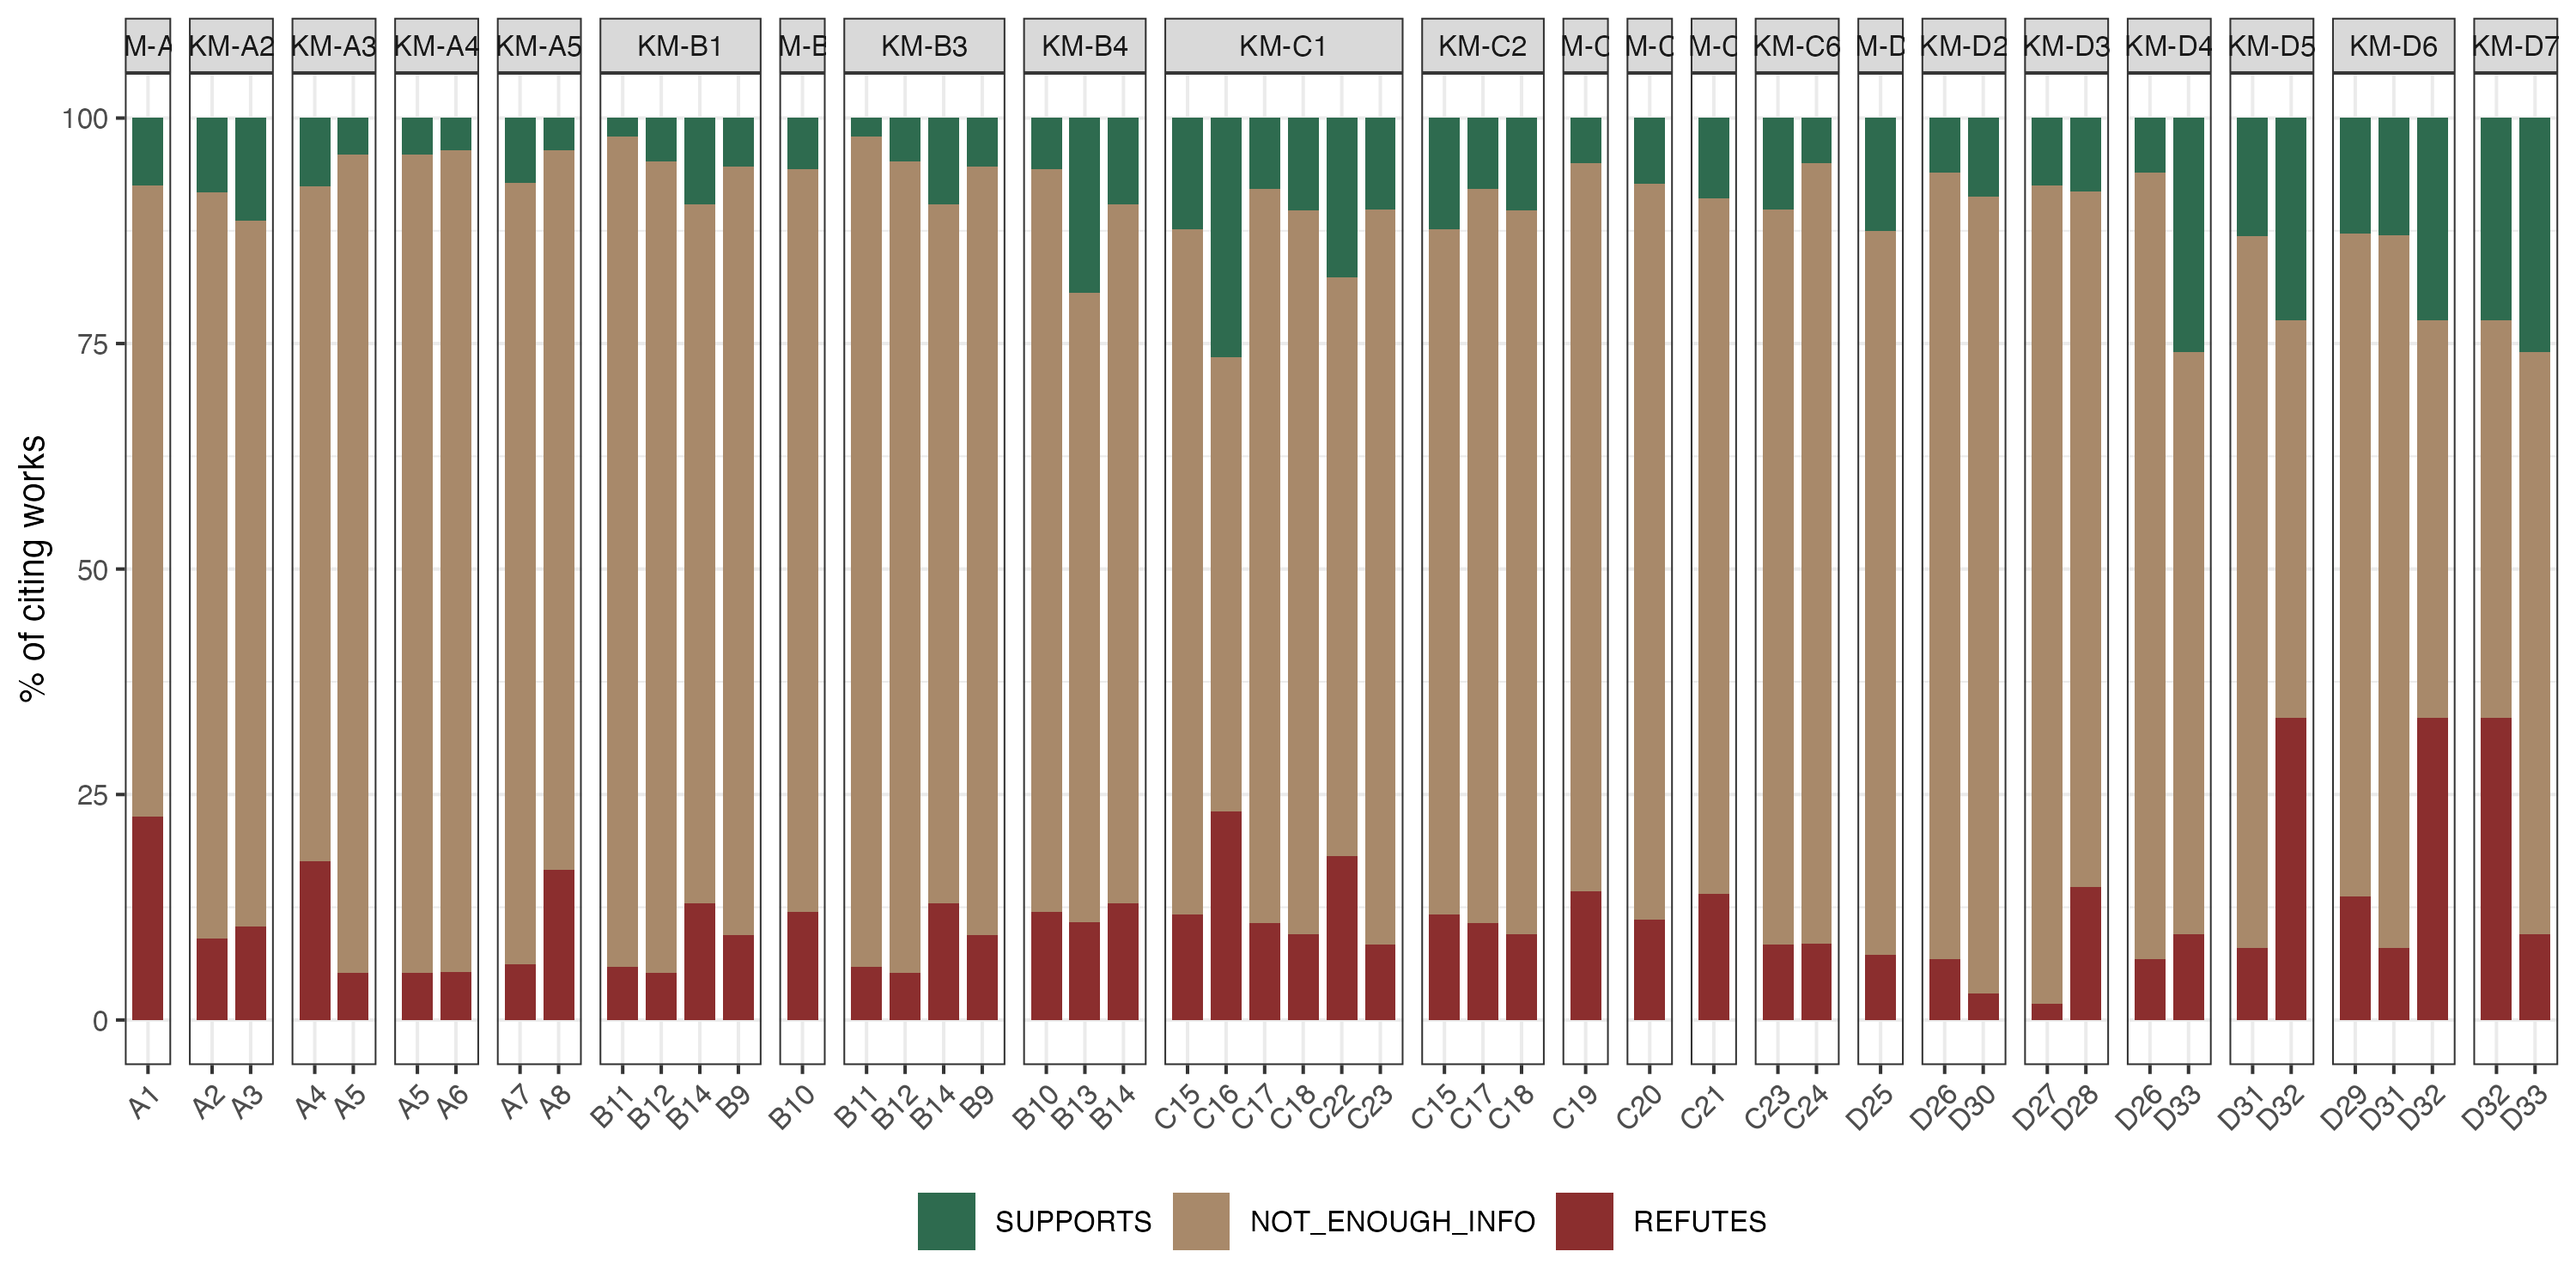
Per Key Message

KM SUPPORTS % NEI % REFUTES %
A. 15.0 72.6 12.5
B. 10.0 75.8 14.2
C. 14.5 64.6 20.9
D. 34.7 54.4 10.9

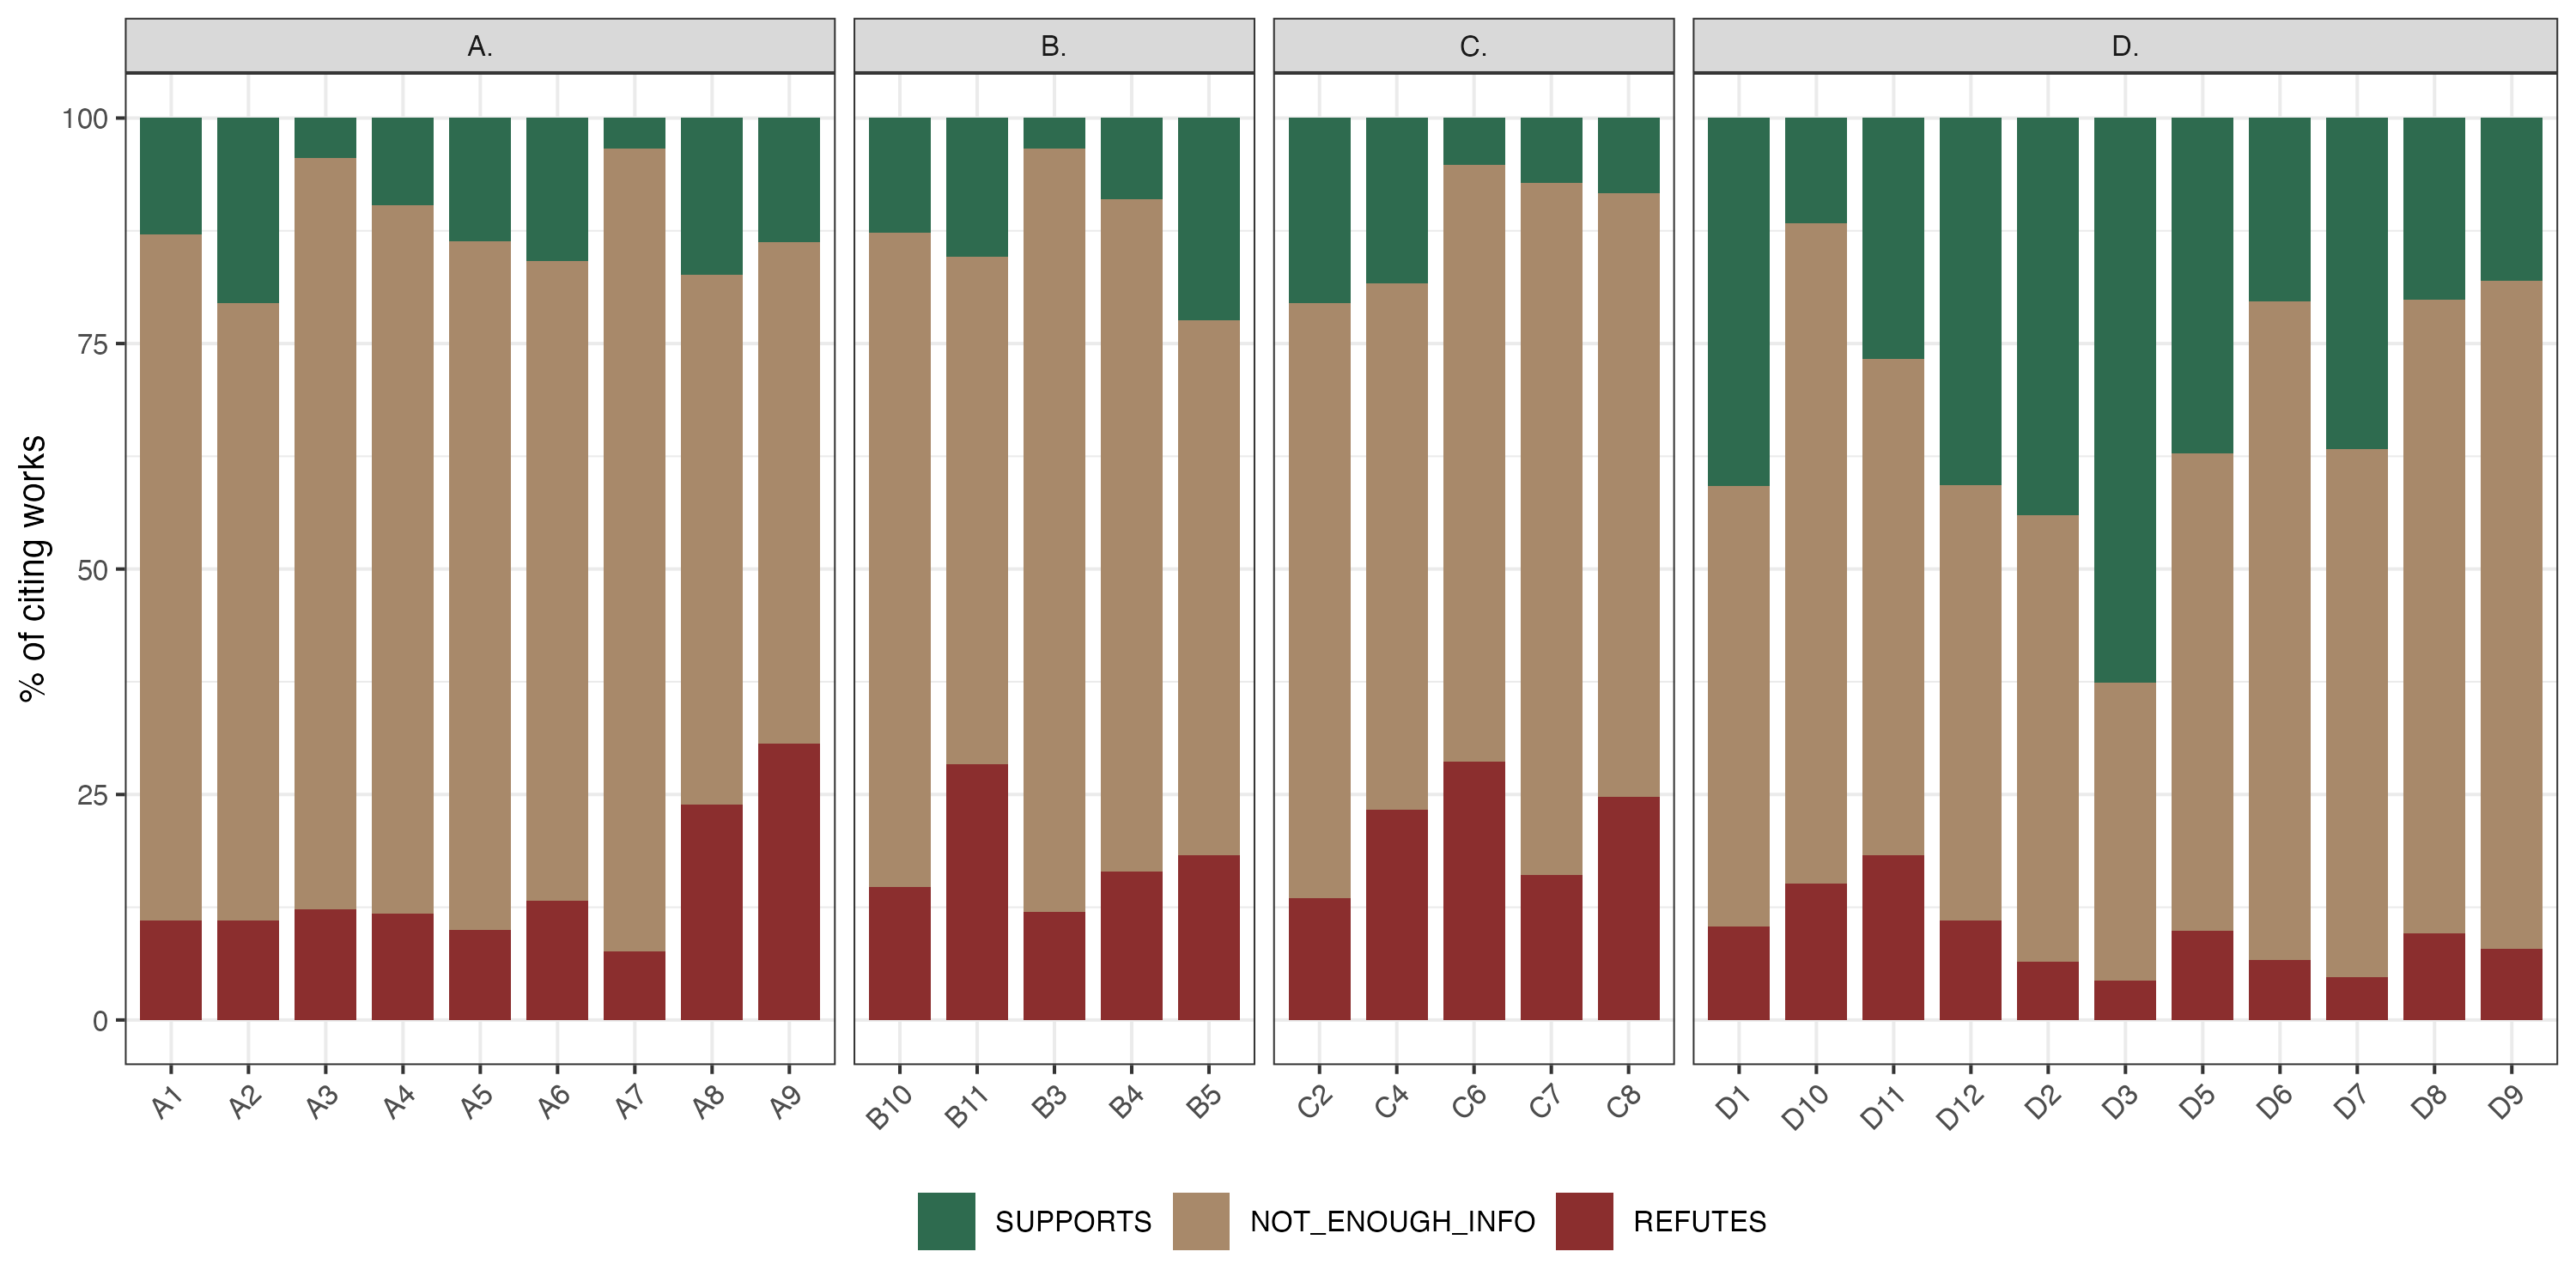
Per Background Message

KM BM SUPPORTS % NEI % REFUTES %
A. A1 12.9 76.1 11.0
A. A2 20.5 68.5 11.0
A. A3 4.4 83.3 12.3
A. A4 9.7 78.5 11.8
A. A5 13.7 76.3 10.0
A. A6 15.8 71.0 13.2
A. A7 3.4 89.0 7.6
A. A8 17.4 58.8 23.9
A. A9 13.8 55.5 30.7
B. B10 12.7 72.5 14.7
B. B11 15.4 56.2 28.4
B. B3 3.3 84.7 12.0
B. B4 9.0 74.6 16.4
B. B5 22.4 59.4 18.2
C. C2 20.5 66.0 13.5
C. C4 18.3 58.4 23.3
C. C6 5.2 66.2 28.6
C. C7 7.1 76.8 16.1
C. C8 8.3 66.9 24.8
D. D1 40.8 48.9 10.3
D. D10 11.6 73.2 15.2
D. D11 26.7 55.0 18.3
D. D12 40.7 48.2 11.1
D. D2 44.0 49.6 6.5
D. D3 62.6 33.1 4.4
D. D5 37.2 52.9 9.9
D. D6 20.3 73.1 6.6
D. D7 36.7 58.6 4.7
D. D8 20.2 70.2 9.6
D. D9 18.0 74.1 7.9

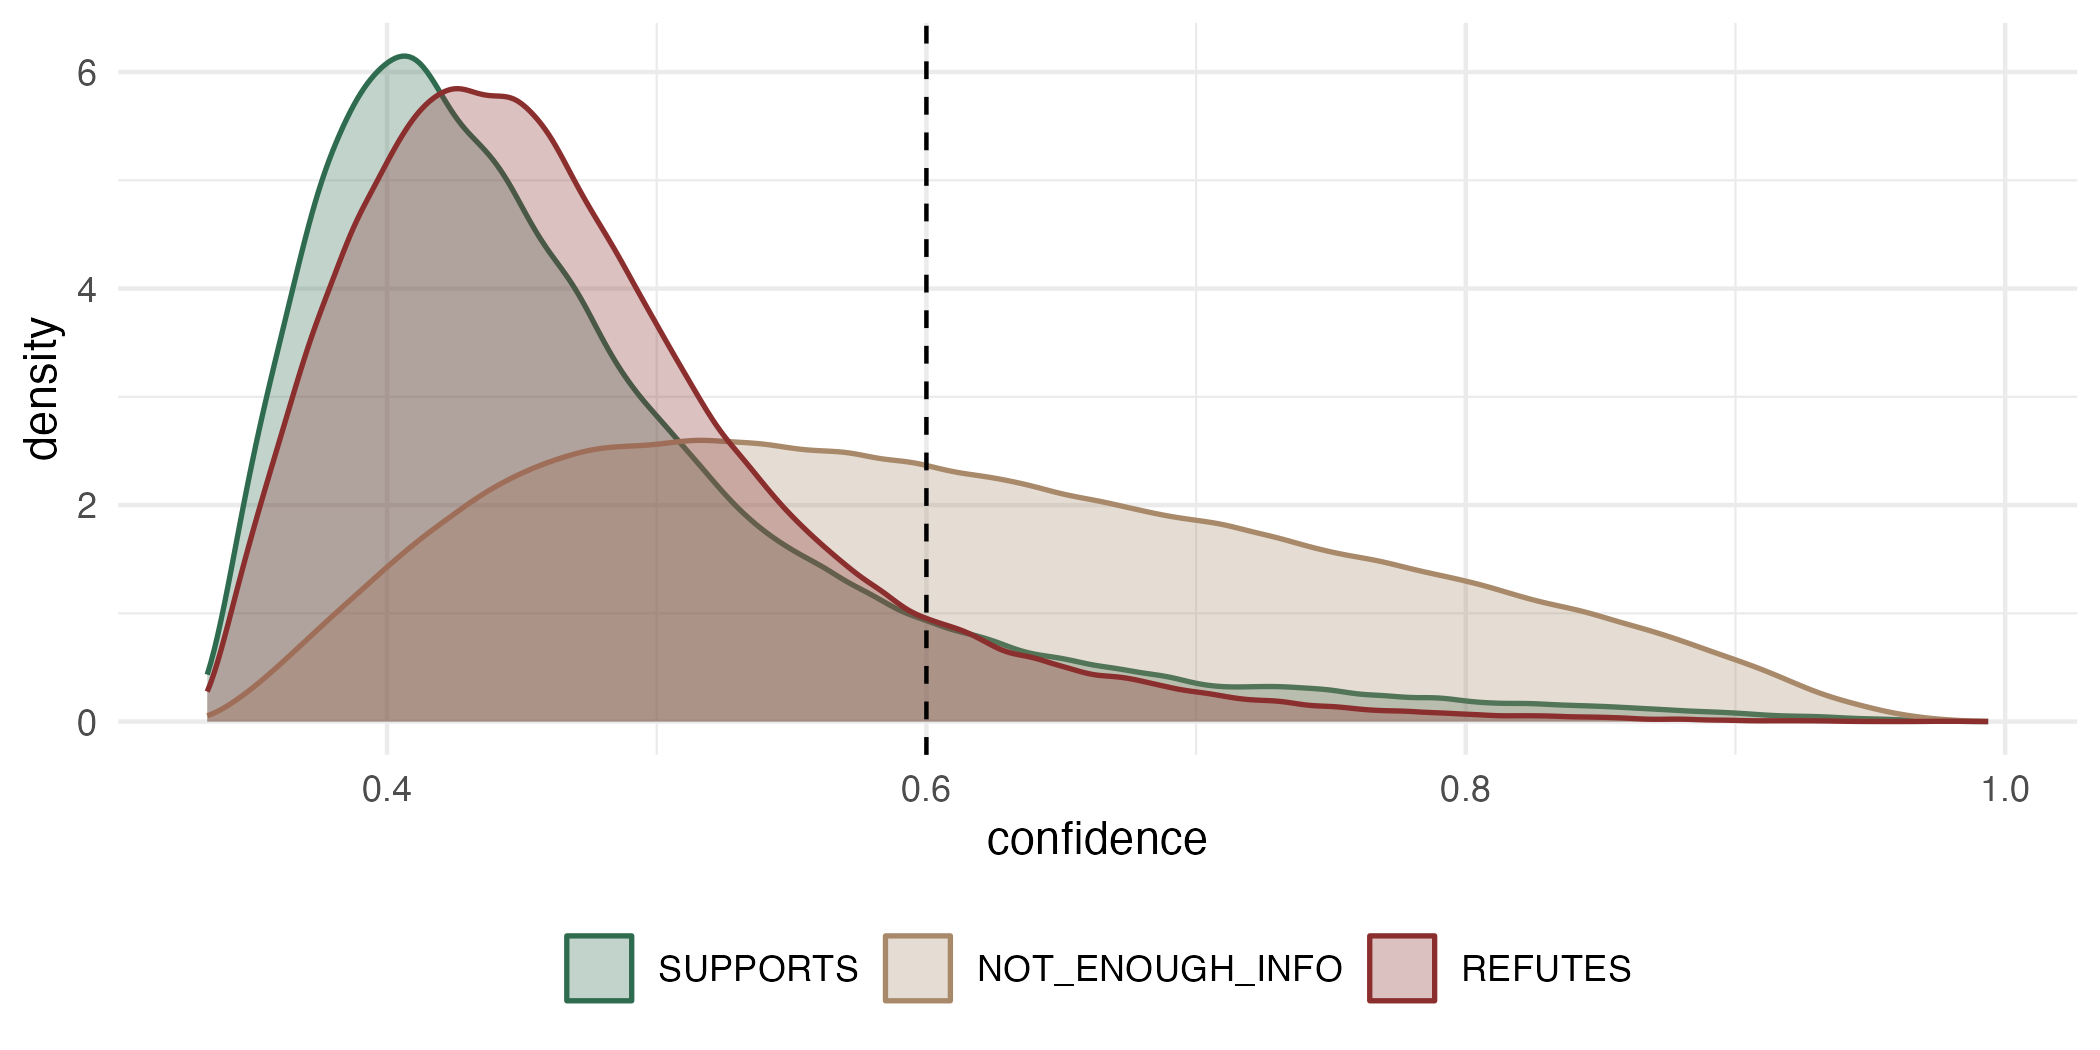
Confidence by label

Label n Mean Median P25 P75
SUPPORTS 300296 0.479 0.451 0.405 0.525
NOT_ENOUGH_INFO 1325765 0.564 0.549 0.464 0.650
REFUTES 243521 0.453 0.437 0.399 0.488

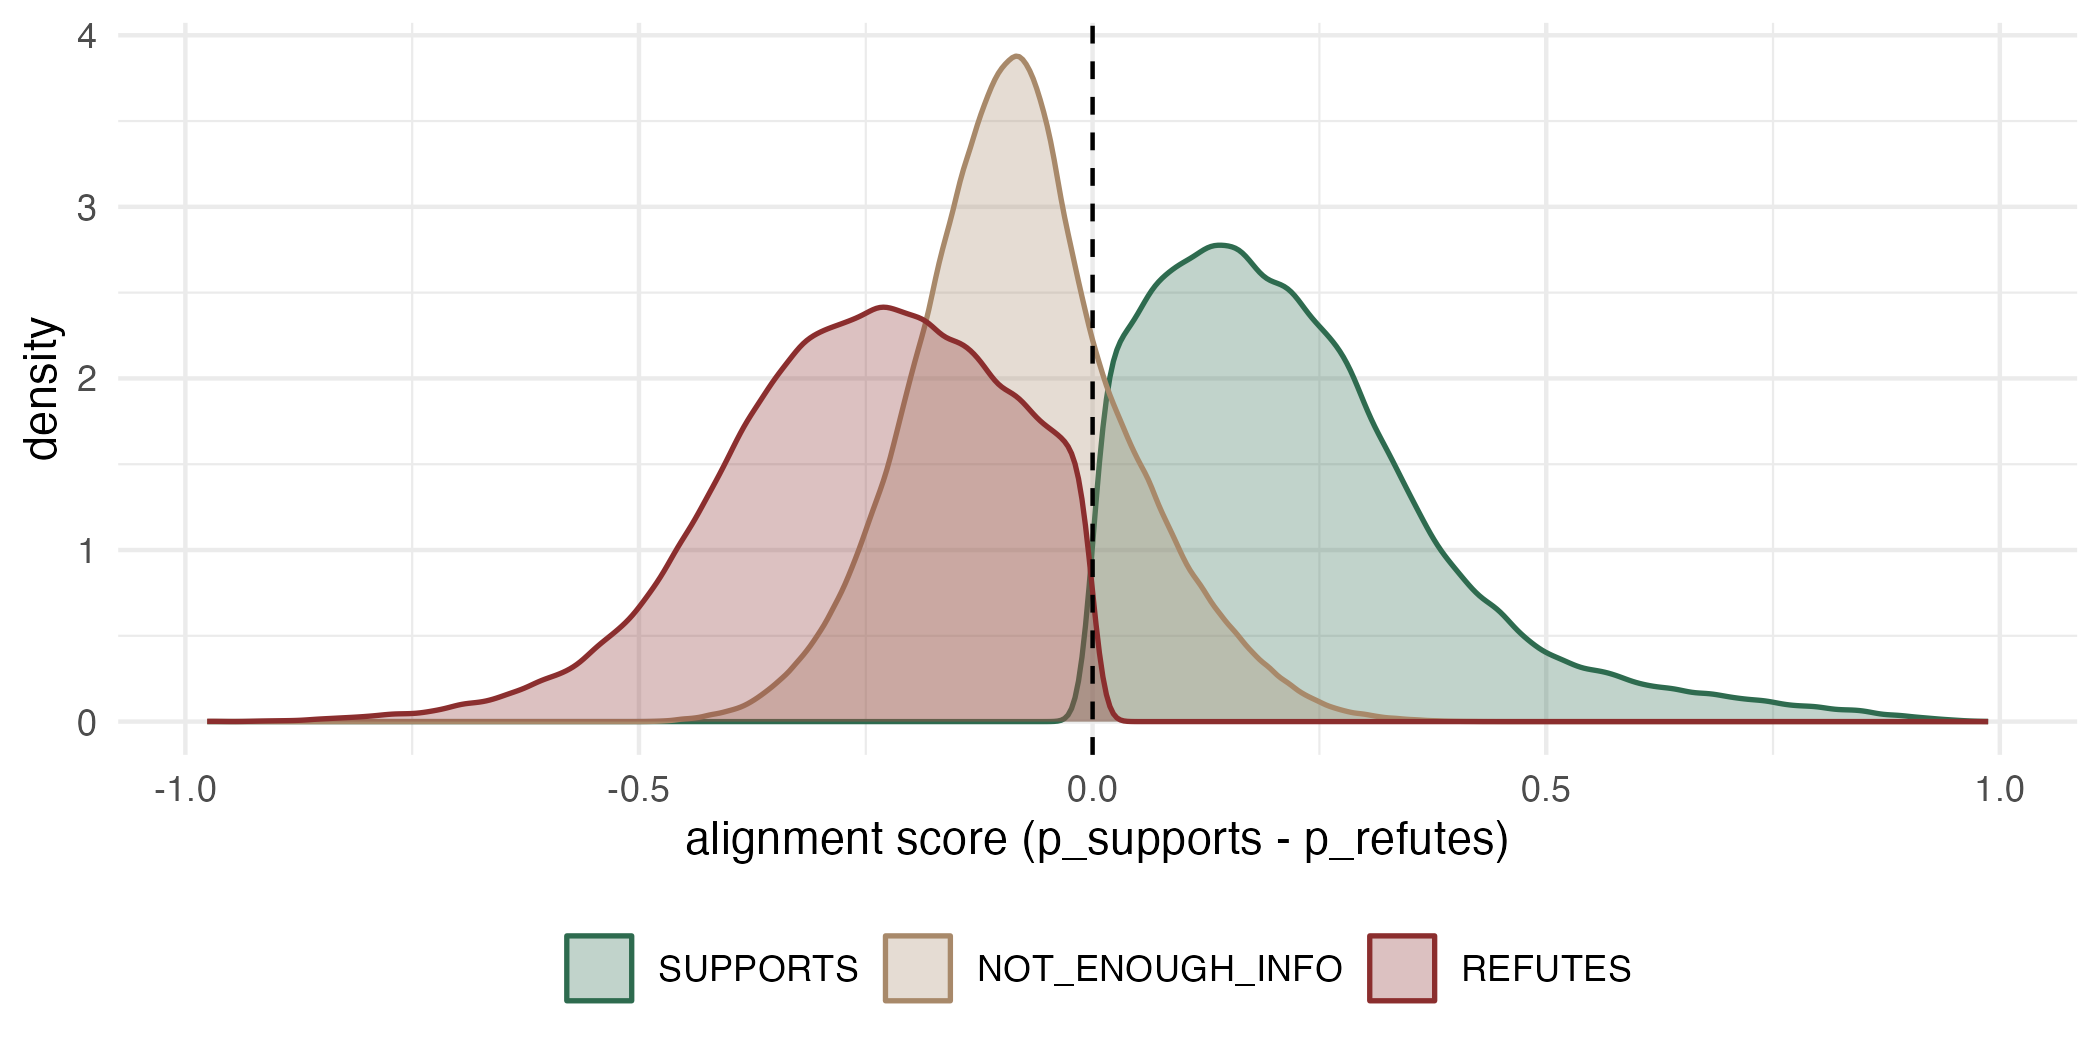
Alignment score per BM

KM BM n Mean aln SD SUPP % REF % NEI % Unc %
A. A1 136548 -0.014 0.175 12.9 11.0 76.1 79.9
A. A2 171018 0.023 0.166 20.5 11.0 68.5 68.1
A. A3 33880 -0.082 0.126 4.4 12.3 83.3 68.6
A. A4 13300 -0.058 0.150 9.7 11.8 78.5 69.9
A. A5 191664 -0.025 0.162 13.7 10.0 76.3 74.0
A. A6 382426 -0.043 0.169 15.8 13.2 71.0 72.9
A. A7 34986 -0.121 0.119 3.4 7.6 89.0 47.6
A. A8 45020 -0.063 0.196 17.4 23.9 58.8 74.9
A. A9 15808 -0.095 0.185 13.8 30.7 55.5 80.5
B. B10 278012 -0.051 0.173 12.7 14.7 72.5 71.6
B. B11 2912 -0.061 0.191 15.4 28.4 56.2 87.7
B. B3 189876 -0.125 0.132 3.3 12.0 84.7 51.0
B. B4 33276 -0.088 0.144 9.0 16.4 74.6 72.3
B. B5 40621 -0.021 0.199 22.4 18.2 59.4 81.9
C. C2 21044 0.016 0.202 20.5 13.5 66.0 75.0
C. C4 14595 -0.026 0.151 18.3 23.3 58.4 77.3
C. C6 13336 -0.159 0.158 5.2 28.6 66.2 76.8
C. C7 2070 -0.050 0.162 7.1 16.1 76.8 77.2
C. C8 6804 -0.136 0.183 8.3 24.8 66.9 76.0
D. D1 34335 0.077 0.205 40.8 10.3 48.9 85.4
D. D10 6395 -0.073 0.166 11.6 15.2 73.2 67.7
D. D11 35608 0.031 0.238 26.7 18.3 55.0 70.8
D. D12 90208 0.096 0.184 40.7 11.1 48.2 89.6
D. D2 19598 0.156 0.233 44.0 6.5 49.6 60.2
D. D3 3370 0.254 0.202 62.6 4.4 33.1 72.4
D. D5 2360 0.095 0.228 37.2 9.9 52.9 78.8
D. D6 12452 0.064 0.164 20.3 6.6 73.1 78.1
D. D7 9740 0.151 0.209 36.7 4.7 58.6 74.8
D. D8 15888 0.021 0.213 20.2 9.6 70.2 67.8
D. D9 12432 0.032 0.195 18.0 7.9 74.1 71.3

AI Based Interpretation

NoteAbout this section

Focused specifically on the SUPPORTS/REFUTES signals — NOT_ENOUGH_INFO (~71% of GA1 pairs) is set aside here as the least informative label. Written against the current scored data (2026-07-06); re-derive the numbers below from the tables above before trusting this after a rerun.

Key finding — KM D is the only reliable signal. GA1 overall SUPPORTS (16.1%) edges out REFUTES (13.0%), but that gap is almost entirely driven by KM D (34.7% SUPPORTS vs 10.9% REFUTES). KMs A–C sit close to parity or worse — A: 15.0% vs 12.5%, B: 10.0% vs 14.2% (REFUTES-inflated), C: 14.5% vs 20.9% (REFUTES-inflated) — so the argmax label there carries little information on its own.

Within KM D, four BMs are unambiguous: D3 (62.6% SUPPORTS vs 4.4% REFUTES), D2 (44.0% vs 6.5%), D1 (40.8% vs 10.3%), and D12 (40.7% vs 11.1%) — all over 40% SUPPORTS at single-digit-to-low-teens REFUTES. The one exception inside KM D is D10, where REFUTES (15.2%) exceeds SUPPORTS (11.6%) — an outlier against its own KM’s pattern, worth treating differently from its D-series siblings.

Likely reason: D-series BMs are probably more concrete and empirically testable — biodiversity metrics, species trends, ecosystem services — the kind of claims abstracts engage with directly.

WarningREFUTES inflation — KMs A, B, C

The BMs with the widest REFUTES-over-SUPPORTS gap:

BM SUPPORTS REFUTES Gap (REFUTES − SUPPORTS)
C6 5.2 % 28.6 % +23.4
A9 13.8 % 30.7 % +16.9
C8 8.3 % 24.8 % +16.5
B11 15.4 % 28.4 % +13.0
C7 7.1 % 16.1 % +9.0
B3 3.3 % 12.0 % +8.7

Citing papers of an assessment being scored as majority-REFUTES at these margins is not credible. This is the well-documented zero-shot NLI failure mode: the hypothesis “This paper refutes the following claim: …” draws spurious entailment when the BM contains complex, multi-part, or politically nuanced language. The model fires on surface-level topical tension rather than genuine contradiction.

NoteClosest to parity — weakest signal

A handful of BMs have SUPPORTS and REFUTES within a couple of points of each other — the argmax label there is close to a coin flip:

  • A1 12.9 % vs 11.0 %
  • B10 12.7 % vs 14.7 %
  • A4 9.7 % vs 11.8 %

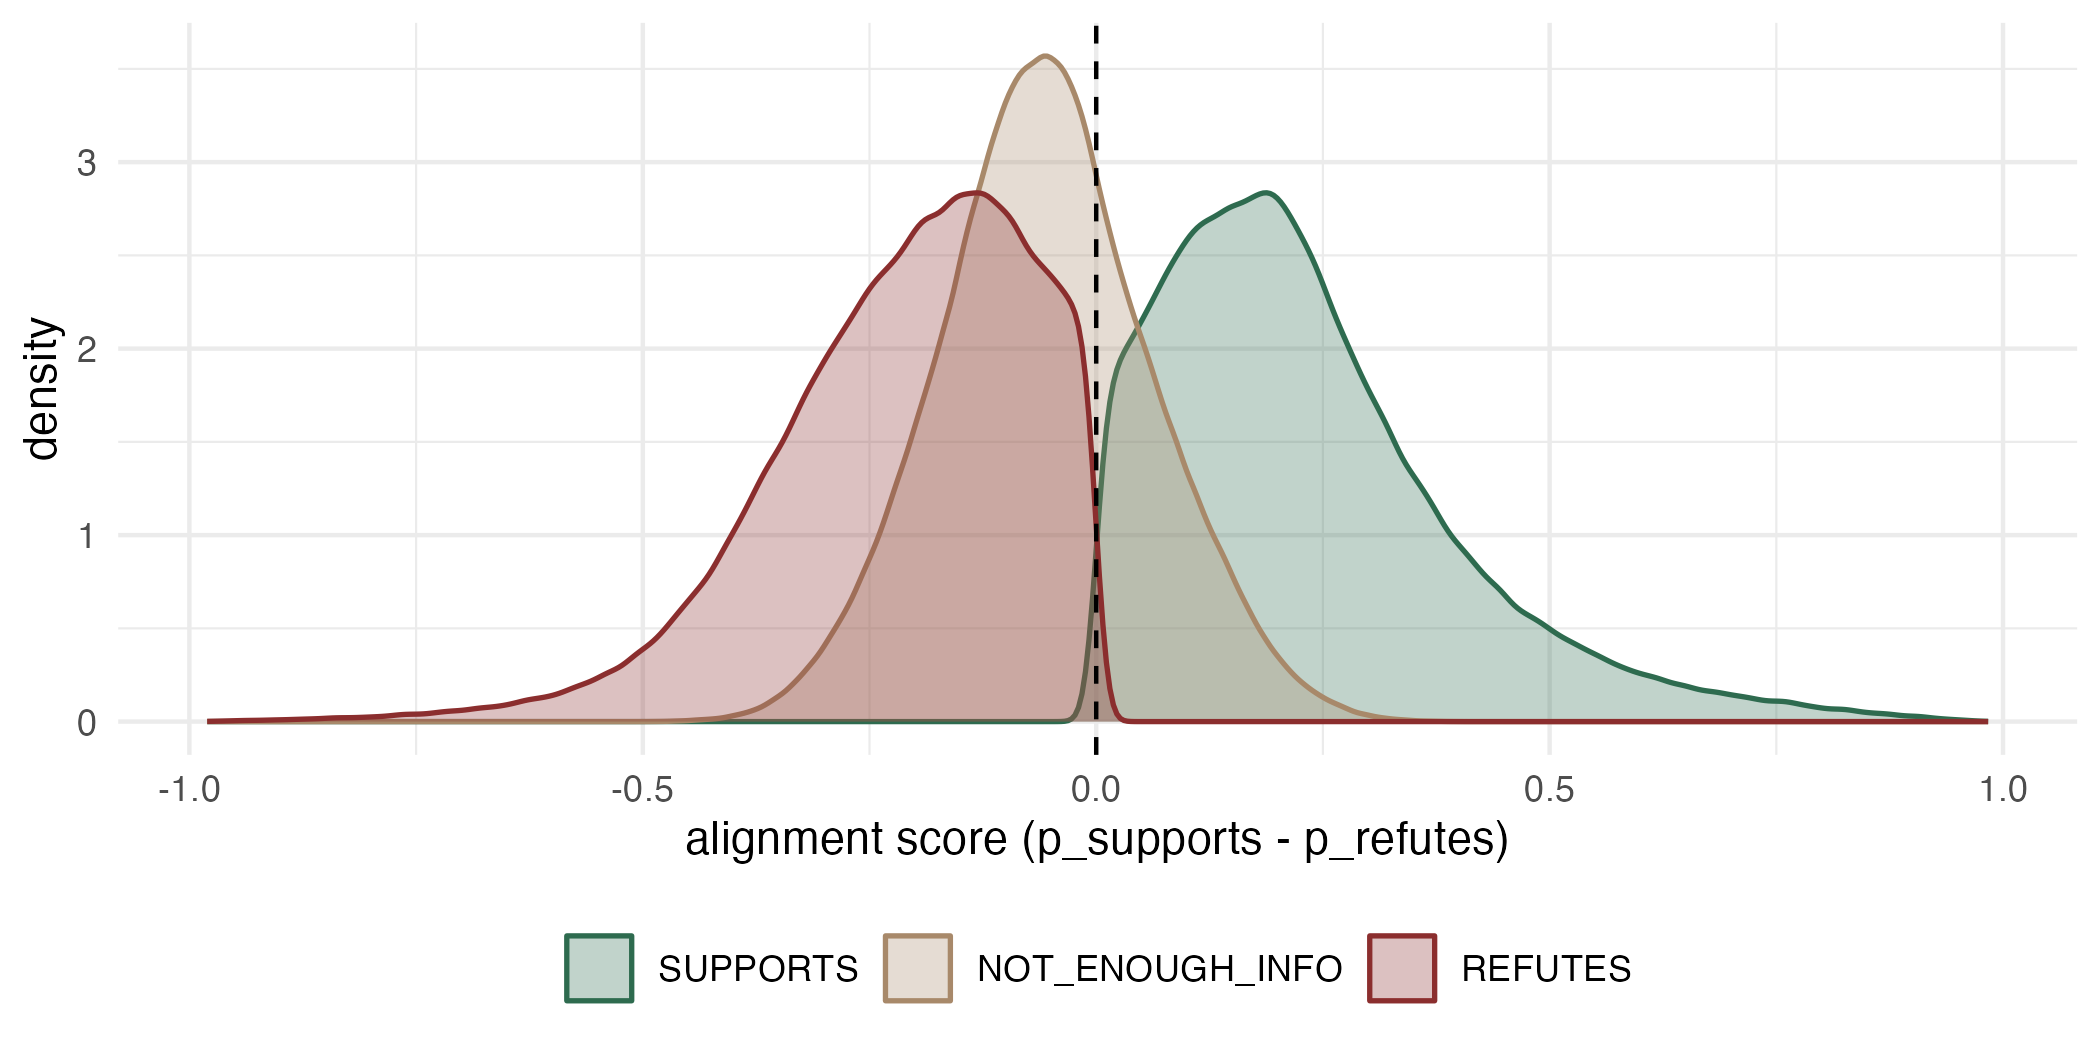
For these, only the continuous alignment score (p_supports − p_refutes) carries any real information.

Notable exception in KM A

A2 (20.5% SUPPORTS, 11.0% REFUTES) is the clearest positive signal in KMs A–C outside of KM D — a nearly 10-point SUPPORTS lead, well ahead of its KM-A neighbours. Its claim is likely more concrete or empirically specific than the rest of KM A — worth inspecting manually as a calibration reference.

Operational implications
  1. Do not act on raw REFUTES labels for KMs A–C without Phase-2 LLM review. NLI here is a coarse NEI filter, not a judgment.
  2. KM D SUPPORTS can be treated as the most reliable signal in the assessment — D3, D2, D1, D12 in particular (all >40% SUPPORTS, single-digit-to-low-teens REFUTES). D10 is the one KM D BM that does NOT fit this pattern.
  3. Use p_supports − p_refutes for ranking rather than argmax labels, especially for the near-parity BMs above.
  4. max_length: 256 is probably hurting KMs A–C. Truncating abstract tails removes findings — the part that matters most for support/refute judgements on conceptual BMs. The base-model-at-512 comparison (deberta_zeroshot_v3) is the highest-priority next experiment.
  5. Fine-tuning on BM citations (TD_NLI_training) would most help KMs A–C — the support/refute axis that zero-shot is fumbling. D-series BMs are already working.

GA1 (complete_bm)

No NLI scores available yet for this assessment/granularity combination.

IAS (sub_bm)

  • 1,677,649 works scored
  • 33 background messages
  • 22 key messages
  • 59.4% uncertain (confidence < 0.60)

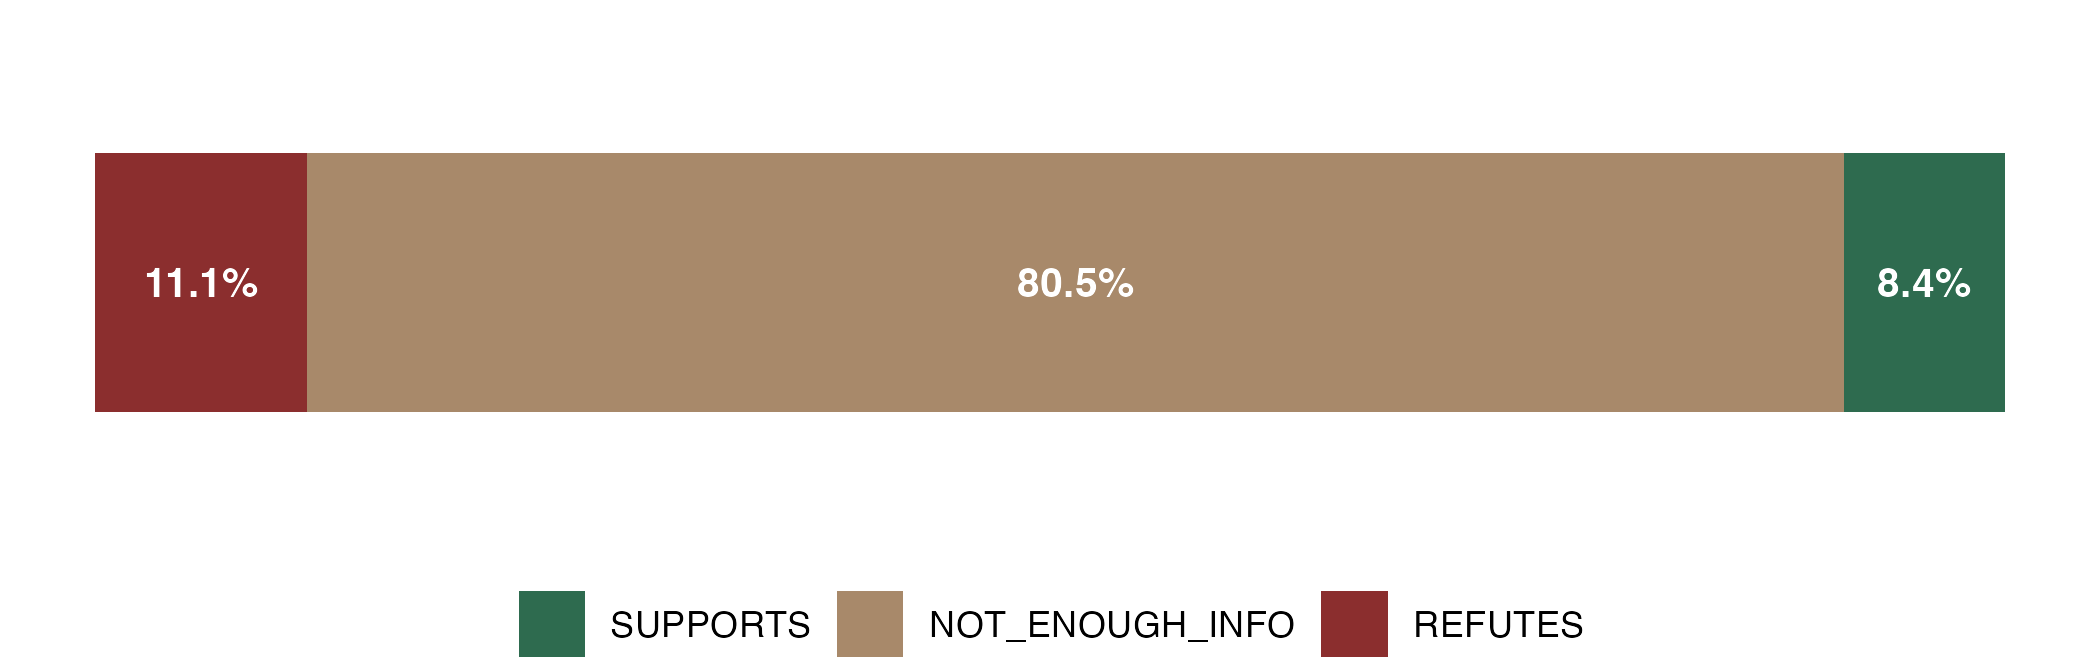
Label distribution

Label Works %
SUPPORTS 140319 8.4
NOT_ENOUGH_INFO 1350590 80.5
REFUTES 186740 11.1

Interactive BM Explorer

Select a background message from the dropdown and a minimum confidence from the slider. All works are always shown; the slider instead splits each bar into a solid segment (confidence at or above the threshold) and a hollow/outlined segment on top (below the threshold, stacked) — in the label-distribution panel (each bar also labelled n / N: works at/above the threshold vs. all works with that label), the confidence panel (with a dashed line marking the threshold), and the alignment panel. Mean/median confidence and the % meeting the threshold are reported above the panels. Below the panels, a second dropdown (default REFUTES) selects which label the drill-down table lists — the actual works for the current BM + threshold + label, sorted by confidence descending and capped at 50 rows (the caption reports the true total when capped). Each work links to its DOI where one exists (OpenAlex otherwise). Download table (CSV) is not limited to the 50 rows shown — it exports up to 5,000 matching works for the current BM + threshold + label (sorted by confidence descending, flagged with a trailing comment line if even that limit truncates the true match count), including the assessment and BM as explicit columns.

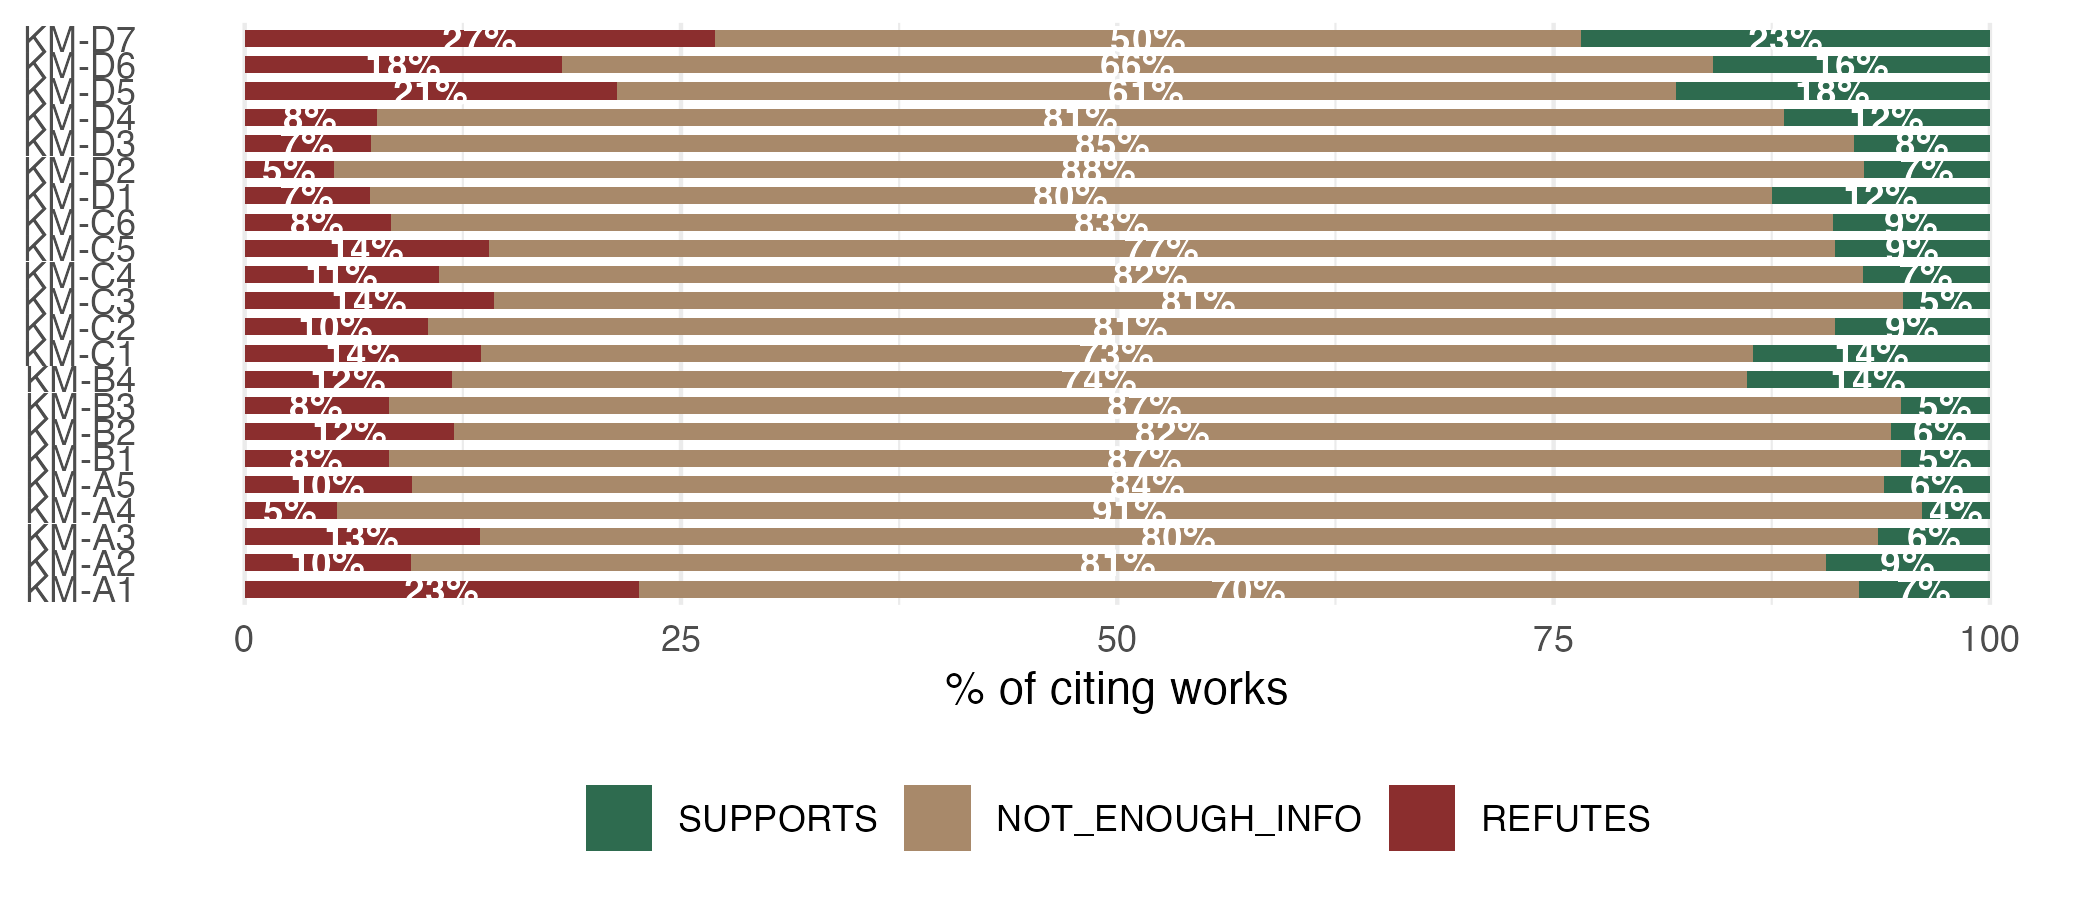
Per Key Message

KM SUPPORTS % NEI % REFUTES %
KM-A1 7.5 69.9 22.6
KM-A2 9.4 81.1 9.5
KM-A3 6.4 80.1 13.5
KM-A4 3.9 90.9 5.3
KM-A5 6.0 84.4 9.6
KM-B1 5.1 86.7 8.3
KM-B2 5.7 82.3 12.0
KM-B3 5.1 86.7 8.3
KM-B4 13.9 74.2 11.9
KM-C1 13.6 72.9 13.5
KM-C2 8.9 80.6 10.5
KM-C3 5.0 80.7 14.3
KM-C4 7.3 81.6 11.1
KM-C5 8.9 77.1 14.0
KM-C6 9.0 82.6 8.4
KM-D1 12.5 80.3 7.2
KM-D2 7.2 87.7 5.1
KM-D3 7.8 85.0 7.2
KM-D4 11.8 80.7 7.6
KM-D5 18.0 60.7 21.3
KM-D6 15.9 66.0 18.2
KM-D7 23.4 49.6 27.0

Per Background Message

KM BM SUPPORTS % NEI % REFUTES %
KM-A1 A1 7.5 69.9 22.6
KM-A2 A2 8.2 82.8 9.0
KM-A2 A3 11.4 78.2 10.4
KM-A3 A4 7.6 74.9 17.6
KM-A3 A5 4.0 90.8 5.2
KM-A4 A5 4.0 90.8 5.2
KM-A4 A6 3.6 91.0 5.4
KM-A5 A7 7.2 86.6 6.2
KM-A5 A8 3.6 79.7 16.7
KM-B1 B11 2.1 92.0 5.9
KM-B1 B12 4.8 89.9 5.3
KM-B1 B14 9.5 77.5 12.9
KM-B1 B9 5.4 85.2 9.4
KM-B2 B10 5.7 82.3 12.0
KM-B3 B11 2.1 92.0 5.9
KM-B3 B12 4.8 89.9 5.3
KM-B3 B14 9.5 77.5 12.9
KM-B3 B9 5.4 85.2 9.4
KM-B4 B10 5.7 82.3 12.0
KM-B4 B13 19.4 69.8 10.8
KM-B4 B14 9.5 77.5 12.9
KM-C1 C15 12.3 75.9 11.7
KM-C1 C16 26.5 50.3 23.1
KM-C1 C17 7.8 81.5 10.7
KM-C1 C18 10.3 80.2 9.5
KM-C1 C22 17.6 64.2 18.2
KM-C1 C23 10.1 81.5 8.3
KM-C2 C15 12.3 75.9 11.7
KM-C2 C17 7.8 81.5 10.7
KM-C2 C18 10.3 80.2 9.5
KM-C3 C19 5.0 80.7 14.3
KM-C4 C20 7.3 81.6 11.1
KM-C5 C21 8.9 77.1 14.0
KM-C6 C23 10.1 81.5 8.3
KM-C6 C24 5.0 86.6 8.4
KM-D1 D25 12.5 80.3 7.2
KM-D2 D26 6.0 87.2 6.8
KM-D2 D30 8.7 88.3 3.0
KM-D3 D27 7.5 90.8 1.8
KM-D3 D28 8.1 77.2 14.7
KM-D4 D26 6.0 87.2 6.8
KM-D4 D33 25.9 64.6 9.5
KM-D5 D31 13.0 79.0 8.0
KM-D5 D32 22.5 44.0 33.5
KM-D6 D29 12.8 73.5 13.7
KM-D6 D31 13.0 79.0 8.0
KM-D6 D32 22.5 44.0 33.5
KM-D7 D32 22.5 44.0 33.5
KM-D7 D33 25.9 64.6 9.5

Confidence by label

Label n Mean Median P25 P75
SUPPORTS 140319 0.470 0.442 0.399 0.508
NOT_ENOUGH_INFO 1350590 0.608 0.593 0.494 0.712
REFUTES 186740 0.468 0.453 0.409 0.508

Alignment score per BM

KM BM n Mean aln SD SUPP % REF % NEI % Unc %
KM-A1 A1 64044 -0.133 0.170 7.5 22.6 69.9 66.0
KM-A2 A2 116088 -0.067 0.181 8.2 9.0 82.8 50.7
KM-A2 A3 70650 -0.069 0.157 11.4 10.4 78.2 61.6
KM-A3 A4 108647 -0.125 0.166 7.6 17.6 74.9 66.2
KM-A3 A5 53840 -0.083 0.137 4.0 5.2 90.8 51.0
KM-A4 A5 53840 -0.083 0.137 4.0 5.2 90.8 51.0
KM-A4 A6 31801 -0.087 0.133 3.6 5.4 91.0 48.1
KM-A5 A7 59696 -0.064 0.151 7.2 6.2 86.6 53.5
KM-A5 A8 28524 -0.140 0.136 3.6 16.7 79.7 67.4
KM-B1 B11 89301 -0.101 0.118 2.1 5.9 92.0 40.0
KM-B1 B12 46188 -0.072 0.143 4.8 5.3 89.9 58.9
KM-B1 B14 60250 -0.068 0.177 9.5 12.9 77.5 66.1
KM-B1 B9 54756 -0.099 0.148 5.4 9.4 85.2 49.6
KM-B2 B10 9170 -0.103 0.143 5.7 12.0 82.3 64.8
KM-B3 B11 89301 -0.101 0.118 2.1 5.9 92.0 40.1
KM-B3 B12 46188 -0.072 0.143 4.8 5.3 89.9 59.0
KM-B3 B14 60250 -0.068 0.177 9.5 12.9 77.5 66.1
KM-B3 B9 54756 -0.099 0.148 5.4 9.4 85.2 49.6
KM-B4 B10 9170 -0.103 0.143 5.7 12.0 82.3 64.8
KM-B4 B13 62244 -0.019 0.172 19.4 10.8 69.8 73.7
KM-B4 B14 60250 -0.068 0.177 9.5 12.9 77.5 66.1
KM-C1 C15 3534 -0.019 0.200 12.3 11.7 75.9 60.4
KM-C1 C16 12978 -0.006 0.185 26.5 23.1 50.3 84.3
KM-C1 C17 25530 -0.072 0.153 7.8 10.7 81.5 62.8
KM-C1 C18 10812 -0.038 0.159 10.3 9.5 80.2 65.6
KM-C1 C22 20988 -0.040 0.214 17.6 18.2 64.2 68.0
KM-C1 C23 19112 -0.040 0.149 10.1 8.3 81.5 67.7
KM-C2 C15 3534 -0.019 0.200 12.3 11.7 75.9 60.4
KM-C2 C17 25530 -0.072 0.153 7.8 10.7 81.5 62.8
KM-C2 C18 10812 -0.038 0.159 10.3 9.5 80.2 65.6
KM-C3 C19 23694 -0.103 0.146 5.0 14.3 80.7 68.5
KM-C4 C20 20319 -0.049 0.161 7.3 11.1 81.6 63.8
KM-C5 C21 43536 -0.071 0.193 8.9 14.0 77.1 65.1
KM-C6 C23 19112 -0.040 0.149 10.1 8.3 81.5 67.7
KM-C6 C24 5244 -0.080 0.174 5.0 8.4 86.6 47.8
KM-D1 D25 8645 0.000 0.165 12.5 7.2 80.3 70.4
KM-D2 D26 17157 -0.063 0.147 6.0 6.8 87.2 52.5
KM-D2 D30 13460 -0.015 0.123 8.7 3.0 88.3 58.5
KM-D3 D27 10374 -0.007 0.130 7.5 1.8 90.8 48.4
KM-D3 D28 7560 -0.080 0.147 8.1 14.7 77.2 71.1
KM-D4 D26 17157 -0.063 0.147 6.0 6.8 87.2 52.5
KM-D4 D33 7025 0.084 0.217 25.9 9.5 64.6 83.9
KM-D5 D31 17166 -0.008 0.197 13.0 8.0 79.0 66.5
KM-D5 D32 18755 -0.036 0.212 22.5 33.5 44.0 83.0
KM-D6 D29 24960 -0.031 0.181 12.8 13.7 73.5 63.0
KM-D6 D31 17166 -0.008 0.197 13.0 8.0 79.0 66.5
KM-D6 D32 18755 -0.036 0.212 22.5 33.5 44.0 83.0
KM-D7 D32 18755 -0.036 0.212 22.5 33.5 44.0 82.9
KM-D7 D33 7025 0.084 0.217 25.9 9.5 64.6 83.9

AI Based Interpretation

NoteAbout this section

Focused specifically on the SUPPORTS/REFUTES signals — NOT_ENOUGH_INFO (~81% of IAS pairs) is set aside here as the least informative label. Written against the current scored data (2026-07-06); re-derive the numbers below from the tables above before trusting this after a rerun.

Key finding — IAS is weaker and more REFUTES-skewed than GA1. Overall, IAS REFUTES (11.1%) actually exceeds SUPPORTS (8.4%) — the opposite of GA1’s overall SUPPORTS lean (16.1% vs 13.0%). Unlike GA1, no IAS BM reaches D-series levels of confidence; the strongest SUPPORTS signal is markedly weaker.

TipStrongest SUPPORTS signal

D33 (25.9% SUPPORTS vs 9.5% REFUTES, a 16-point lead) is the clearest positive signal in IAS, appearing under both KM-D4 and KM-D7. A handful of others lean the same way but at much lower absolute rates: B13 (19.4% vs 10.8%), D30 (8.7% vs 3.0%), D27 (7.5% vs 1.8%), and D25 (12.5% vs 7.2%). None of these approach GA1’s D3/D2/D1/D12 margins.

WarningREFUTES inflation

The BMs with the widest REFUTES-over-SUPPORTS gap — the same zero-shot failure mode documented for GA1’s KMs A–C:

BM SUPPORTS REFUTES Gap (REFUTES − SUPPORTS)
A1 7.5 % 22.6 % +15.1
A8 3.6 % 16.7 % +13.1
D32 22.5 % 33.5 % +11.0
A4 7.6 % 17.6 % +10.0
C19 5.0 % 14.3 % +9.3
D28 8.1 % 14.7 % +6.6

D32 is a special case: both SUPPORTS and REFUTES are elevated (22.5% and 33.5%) rather than REFUTES alone — it appears under three different KMs (KM-D5, KM-D6, KM-D7), which may mean it’s a genuinely contested or multi-faceted claim rather than a pure model artifact, and is worth a manual look before writing it off as noise.

Operational implications
  1. Do not act on raw REFUTES labels anywhere in IAS without Phase-2 LLM review — the overall REFUTES-over-SUPPORTS skew makes this an even higher priority here than for GA1’s KMs A–C.
  2. D33 is the one IAS BM currently worth treating as a real signal — everything else is either near parity or REFUTES-leaning.
  3. Use p_supports − p_refutes for ranking rather than argmax labels; IAS’s overall skew means a plain SUPPORTS-label count will systematically undercount real support.
  4. D32 deserves manual review before either accepting or discarding it — high confidence in both directions, across multiple KMs, is a different failure mode from the single-direction REFUTES inflation seen elsewhere.

IAS (complete_bm)

No NLI scores available yet for this assessment/granularity combination.

Funnel Reports

Companion per-assessment reports narrow REFUTES- and SUPPORTS-labelled citing works down through NLI certainty and LLM re-verification. See each report’s own Methodology section for the full 3-level sieve definition.

Show the code
# Plain relative links, not iframes/copy_into_report_files(): each funnel
# report is a full standalone page meant to be opened on its own, and both
# it and this report sit as flat siblings both in the project root and in
# output/reports/ (build_report_output_dir()), so a relative link resolves
# in both places with no copying needed here.
label_funnel_html_paths <- c(
  targets::tar_read(report_refutes_funnel_html),
  targets::tar_read(report_supports_funnel_html)
)
for (p in label_funnel_html_paths) {
  # Assessment ids are alphanumeric (GA1, IAS); an optional trailing
  # "_<granularity>" (e.g. "_complete_bm") is only present for non-default
  # granularities -- sub_bm's filenames are unchanged/unsuffixed.
  m <- regmatches(
    basename(p),
    regexec("^IPBES_([A-Z]+)_Report_([A-Za-z0-9]+)(?:_(.+))?\\.html$", basename(p))
  )[[1]]
  label <- m[[2]]
  id <- m[[3]]
  gran <- if (nzchar(m[[4]])) m[[4]] else "sub_bm"
  cat(sprintf("- [%s %s Funnel Report (%s)](%s)\n", id, label, gran, basename(p)))
}

Reuse

Citation

BibTeX citation:
@report{m_krug2026,
  author = {M Krug, Rainer},
  title = {Fact {Checker} {DRAFT}},
  date = {2026-08-18},
  doi = {xxxxxxxxxxxxxx},
  langid = {en},
  abstract = {The assessments Linked Open Data is used to conduct
    analysis and searches to discover new knowledge related to the
    assessments.}
}
For attribution, please cite this work as:
M Krug, Rainer. 2026. Fact Checker DRAFT. https://doi.org/xxxxxxxxxxxxxx.